 |
 |
 |
|
 |
|
 |
|
|
|
Scientific files |
|
|
| |
 |
Brief memorandum on the Kuril Islands earthquake
on November 15, 2006 |
 Analysis of seismic data Analysis of seismic data
On November 15, 2006 at 11:14 am UT, a strong earthquake occurred in the Kuril Islands in the north of the Pacific Ocean. The characteristics of the event are as follows:
| Date |
15/11/2006 |
| Origin Time |
11:14 am (UT) |
| Latitude |
46 DEG 50 MN NORTH |
| Longitude |
153 DEG 22 MN EAST |
| Magnitude |
8.3 |
|
Given its high magnitude (estimated at 8.1 by TREMORS, which analyzes available seismic recordings in the DASE laboratory in Polynesia, and then revised to 8.3, see Figure 5), this earthquake triggered an alert on the Polynesian Seismic Network as well as on the European-Mediterranean Seismological Centre monitoring network.
Figure 1 shows the signal recorded on the long-period channel of the French station in Lormes (Morvan).
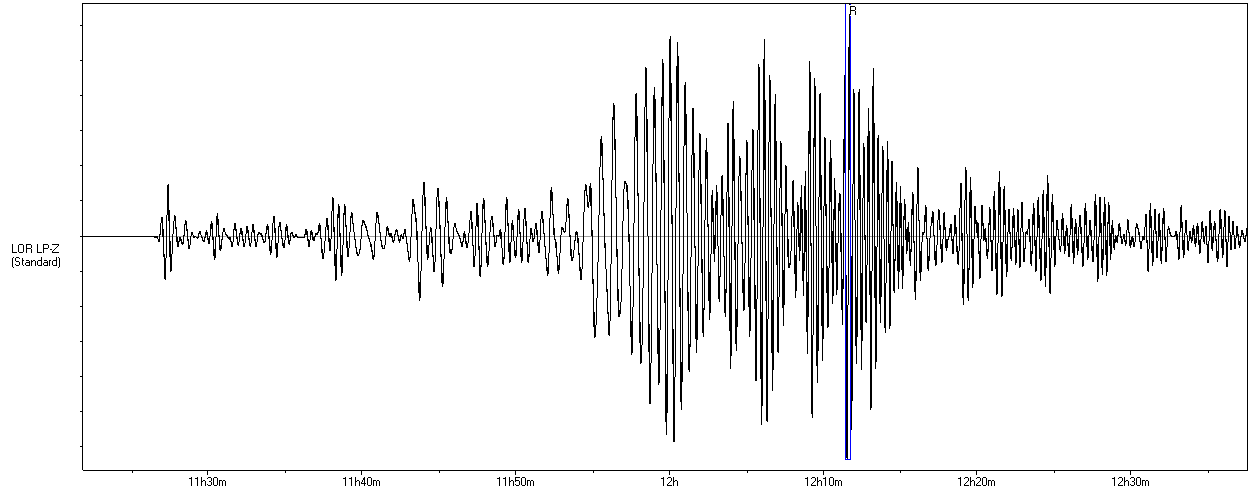
 Figure 1: Signal recorded on LOR station. Figure 1: Signal recorded on LOR station.
The distance from the epicenter is about 9000 km. The ground displacement amplitude reached 1 mm in France.
Seismotectonic setting
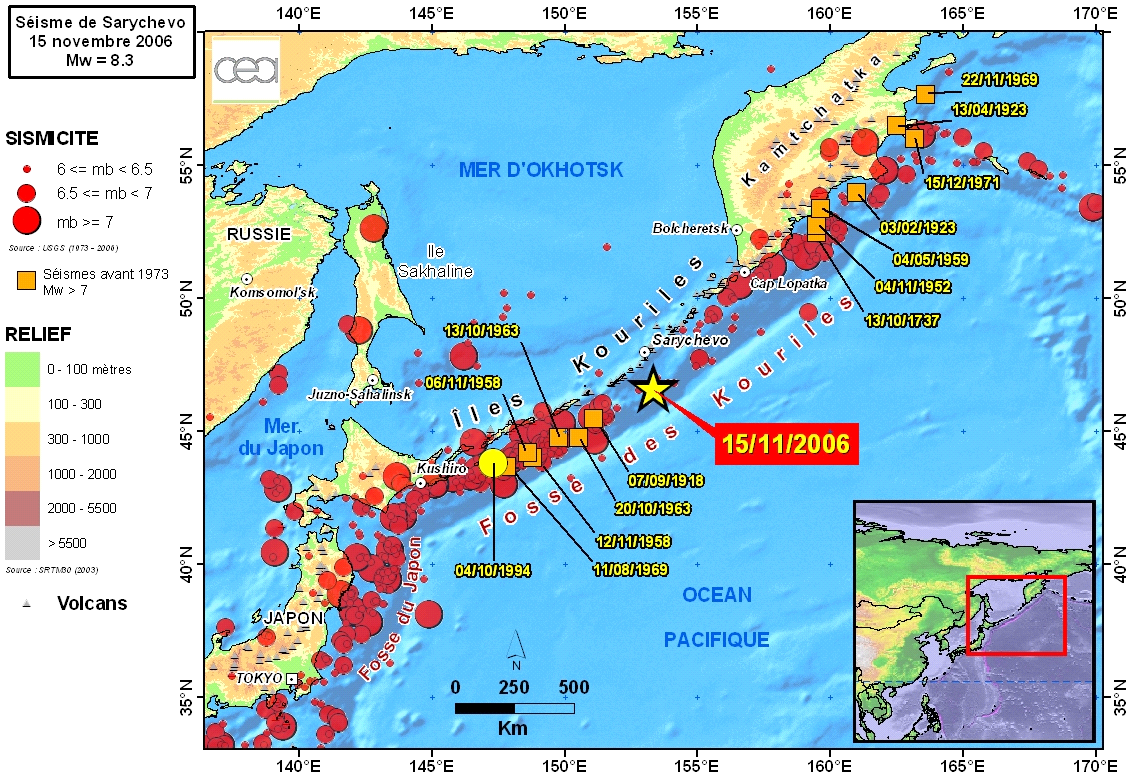
Figure 2: Map representing seismicity in the area (1973-2004, source: USGS).
The Kuril Islands are an archipelago of volcanic islands, 1200 kilometers long, running from the far north of Japan to the southern tip of the Kamtchatka peninsula. This archipelago is an island arc created by subduction of the Pacific plate under the Okhotsk plate (Figure 2).
The focal mechanism obtained by waveform inversion (see following paragraph) is compatible with a subduction mechanism with a small dip angle (about 15°).
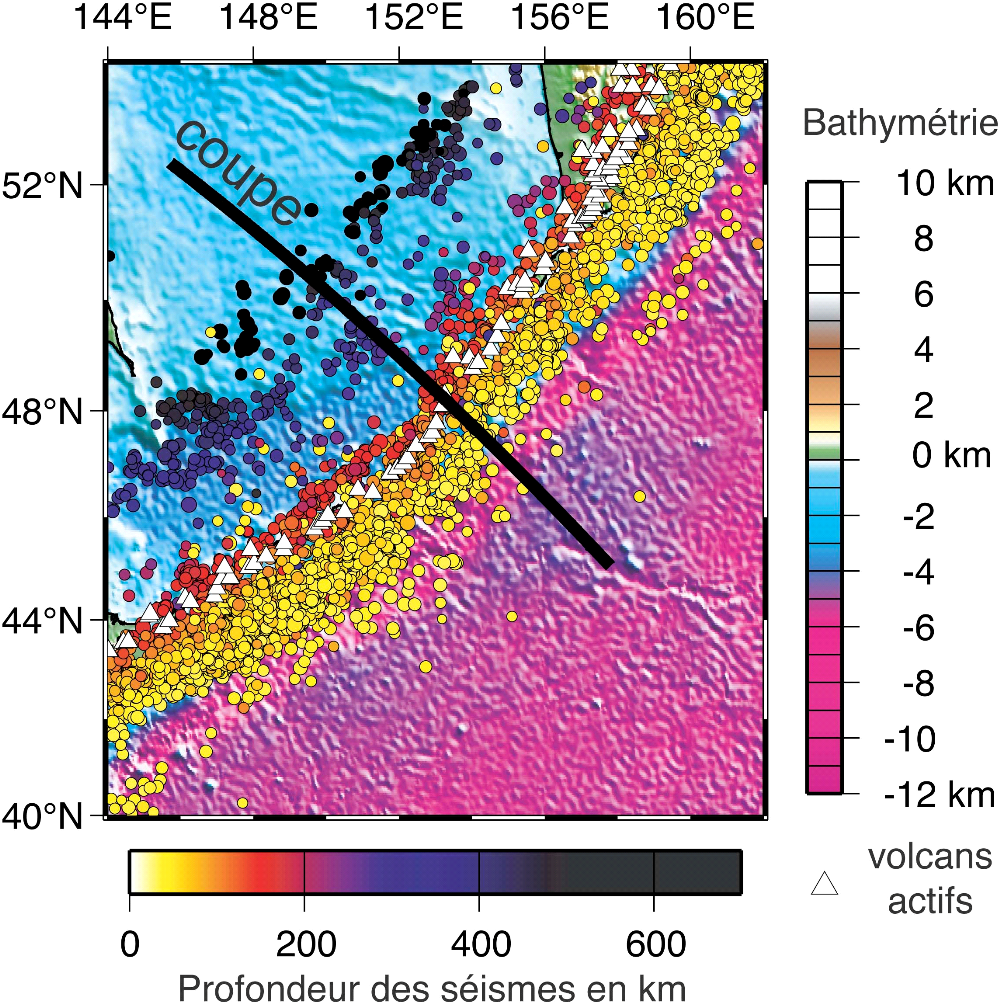
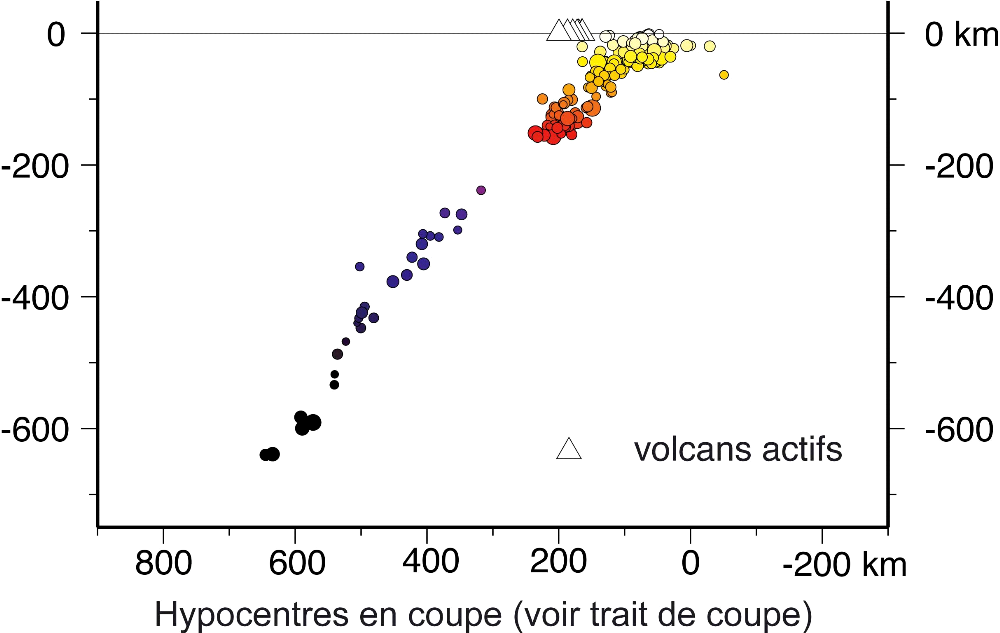
Figure 3: Subduction zone of the Kuril Islands horizontal and cross planes. The depth of the seismic hypocenters is indicated by the color chart (yellow for shallowest and black for deepest). According to Lallemand et al., 2005 (Convergences lithosphériques - Continents et tectonique des plaques [Lithospheric convergence - Continents and plate tectonics]).
In the epicentral area, the Pacific plate is plunging NW beneath the Okhotsk plate at a rate of about 90 mm/year. It remains seismically active to a depth of about 700 km (Figure 3). The main shock of November 15, 2006 occurred at a shallow depth and less than 80 km from the Kuril trench. Finally, numerous aftershocks occurred (two of which of magnitude above 6.0) in the hour following the main shock. Almost 100 events were identified by DASE analysts 21 hours after the main shock (Figure 4).
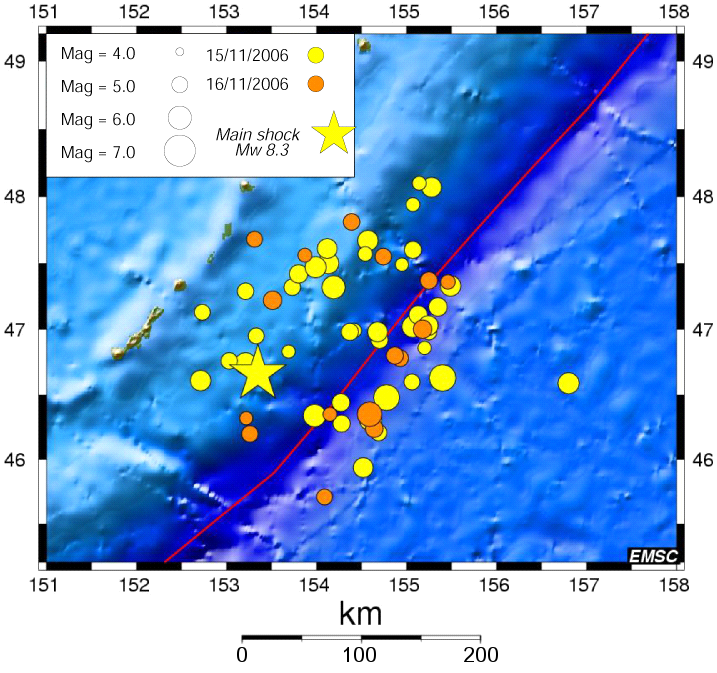
Figure 4: Aftershocks of the Kuril Islands earthquake of November 15, 2006, magnitude 8.3.
The main shock of November 15, 2006 is the largest earthquake to have occurred in the central Kuril Islands since the beginning of the 20th century. An earthquake with a magnitude of about 8 occurred in this area in 1915. The central part of the Kuril Islands is the seat of at least one earthquake of a magnitude above 6 every decade, not including the aftershocks of major events. Further south-west, a major earthquake of magnitude 8.5 occurred in 1963. More recently, an earthquake of magnitude 8.2 occurred in the north of Japan on October 4, 1994. Further north-east, an earthquake of a magnitude of about 9 occurred off the Kamchatka coast in 1952 (Figure 2).
Analysis of the source
The geometry and history of the source were studied using two approaches which produced extremely similar results. The fault extends for about 250 km, its horizontal line is oriented at an azimuth of 214° in relation to north. It plunges NW with a small dip of about 15°.
Figure 5 illustrates waveform inversion of the Rayleigh waves by TREMORS software. It represents the diagram of radiation measured for this wave type, which can be used to obtain source geometry and a good estimation of the magnitude (8.3).
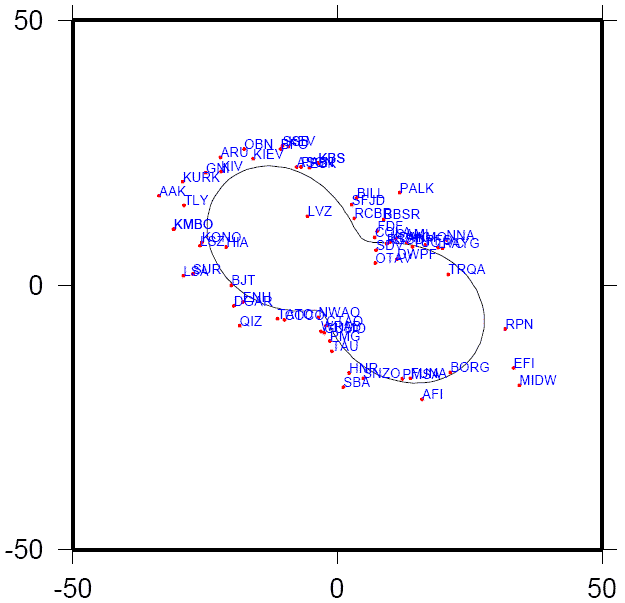
Figure 5: Diagram of Rayleigh wave radiation obtained by TREMORS software in the 293 s period.
Figures 6, 7 and 8 show the inversion obtained from the body waves (P and S waves) using IRIS network and DASE stations.
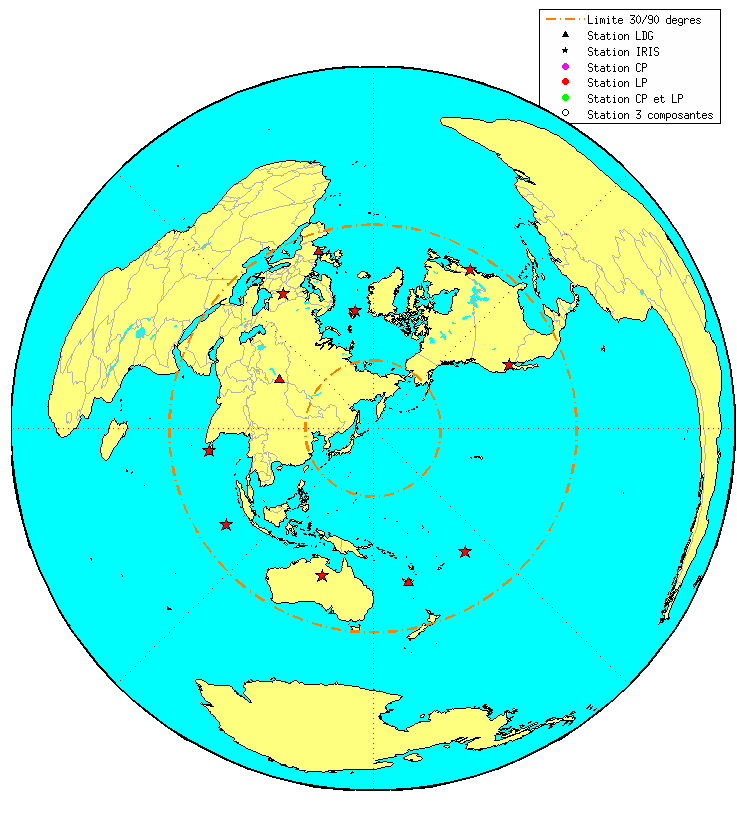
Figure 6: Distribution of the stations used for body wave inversion.
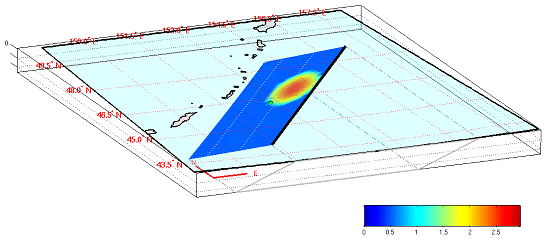
Figure 7: 3D view of the ruptured fault. The color represents the displacement obtained by inversion. The maximum displacement value is about 3 meters, and the ruptured area extends unilaterally for about 250 km.
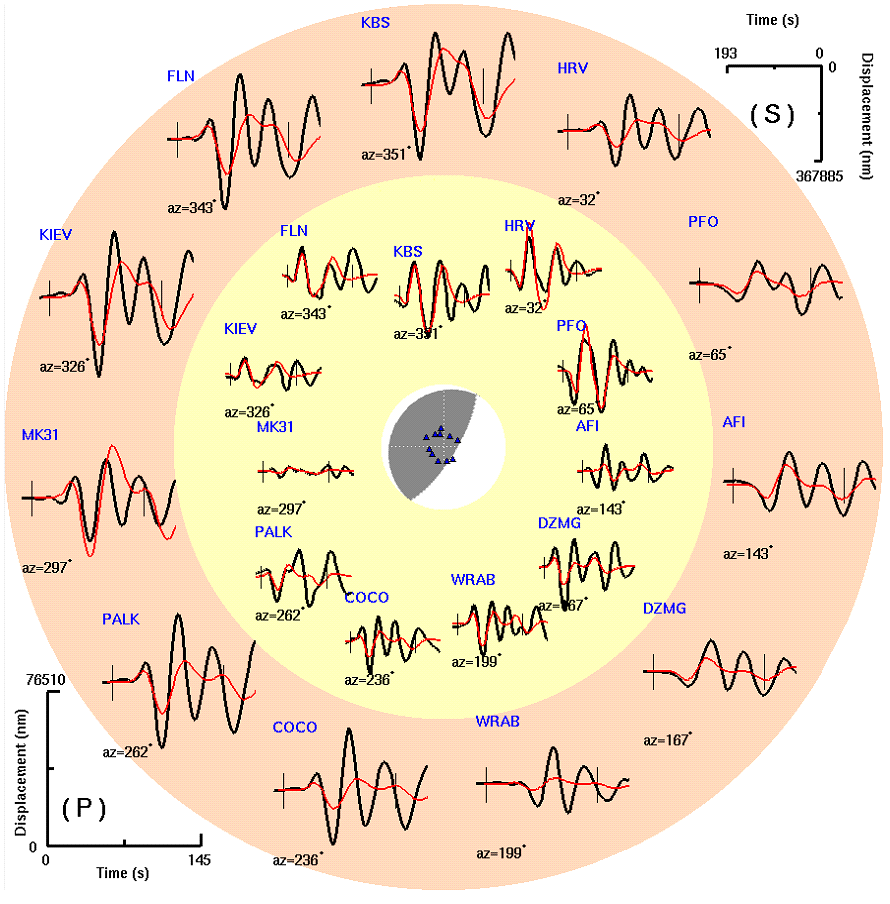
Figure 8: Comparison between synthetic signals (red) and observed signals (black). The yellow disk corresponds to the S waves, the beige circle corresponds to the P waves. The focal mechanism is indicated in the center.
|
The tsunami |
A tsunami was triggered about 1 to 1.5 hours after the earthquake and tide gauge data were available in Hokkaido (north of Japan). The peak-to-trough amplitudes are of the order of 25 to 30 cm.
The first tsunami real-time reporting buoy (DART) that was reached off the Aleutians measured a first wave of 7 cm crest. The inversion of these tsunami data alone confirmed a source of magnitude 8.1.
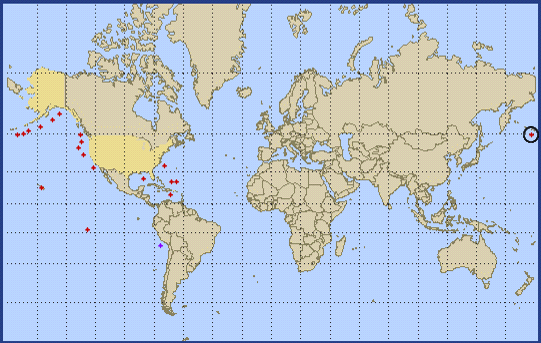
Figure 9: DART buoys for the Pacific alert system, and first buoy to have registered the waves in the open sea (circle).
Propagation in the Pacific
The arrival times calculated (Figure 10) show that French Polynesia is hit around 11 hours after the earthquake, i.e. between 10:30 pm and 11:00 pm UT.
In comparison with the nearby Kuril Islands earthquake in 1994, the directivity of the tsunami wave appears to be more oriented towards Polynesia (Figures 11 and 12), but for these distant sources, the attenuation is such that the amplitudes should not have exceeded 6-8 cm off the coast of Polynesia.
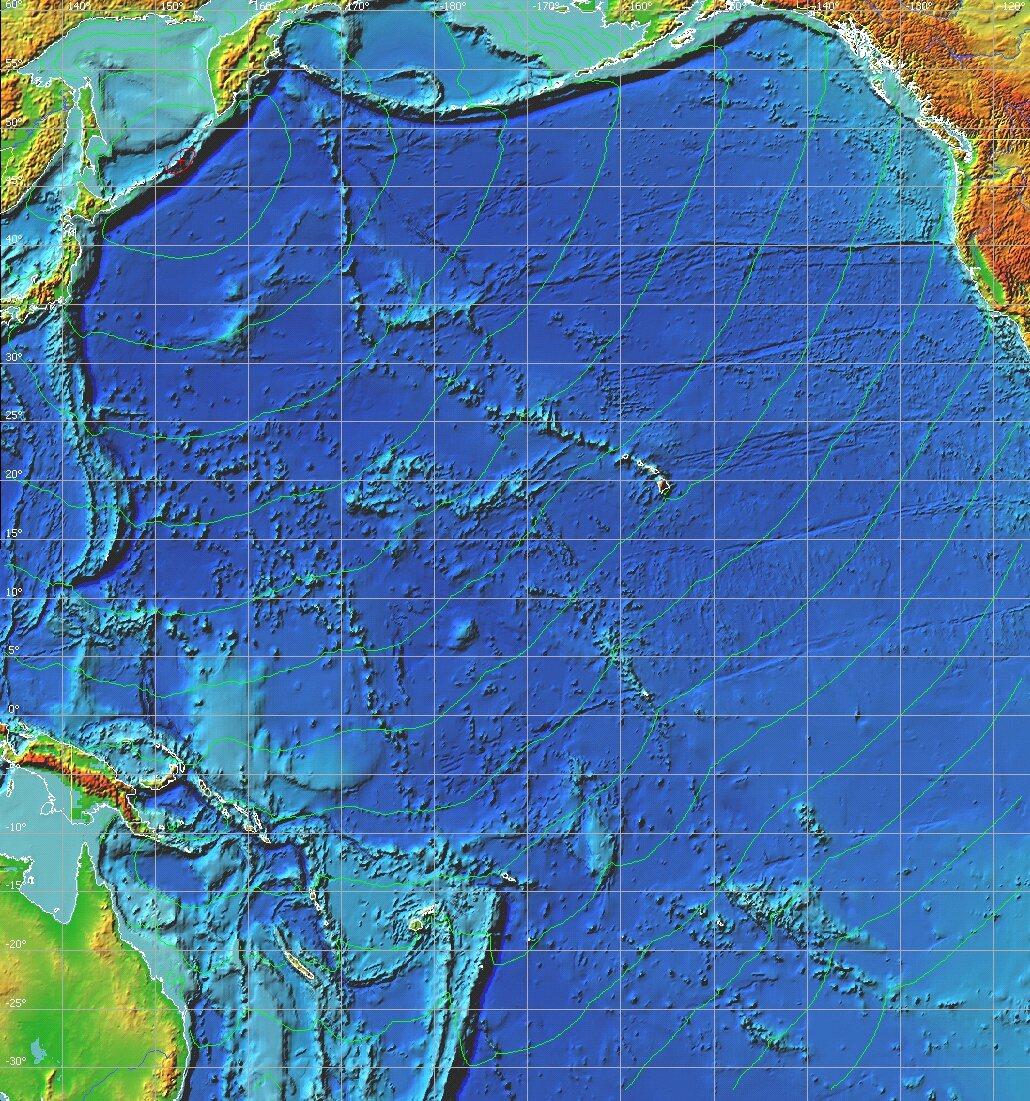
Figure 10: Calculation of arrival times in the Pacific (1 hour between each curve).
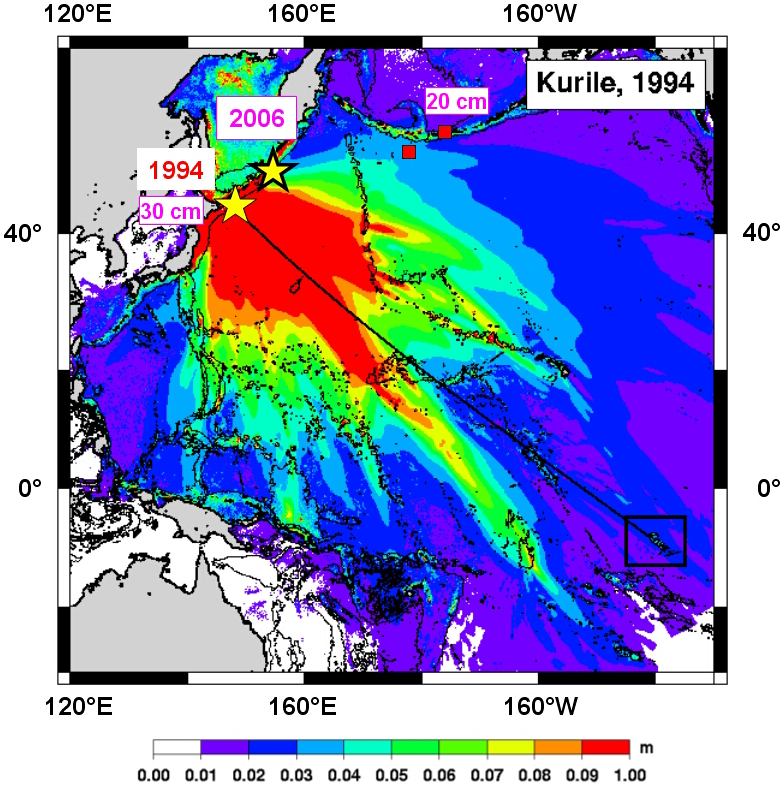
Figure 11: Simulation of directivity of the 1994 tsunami.
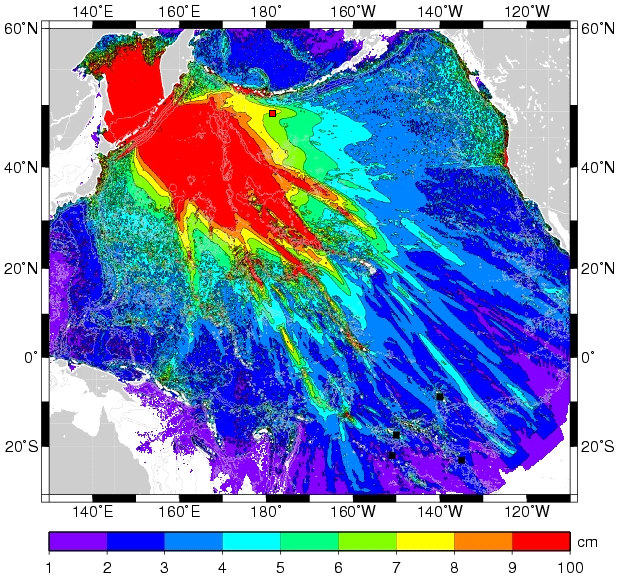
Figure 12: Simulation of the 2006 tsunami. It indicates that the directivity is more directly oriented towards French Polynesia, and particularly the Marquesas Islands (black squares), than in 1994. The data of the DART buoy, which measured 7 cm (red square), are slightly higher in the simulation.
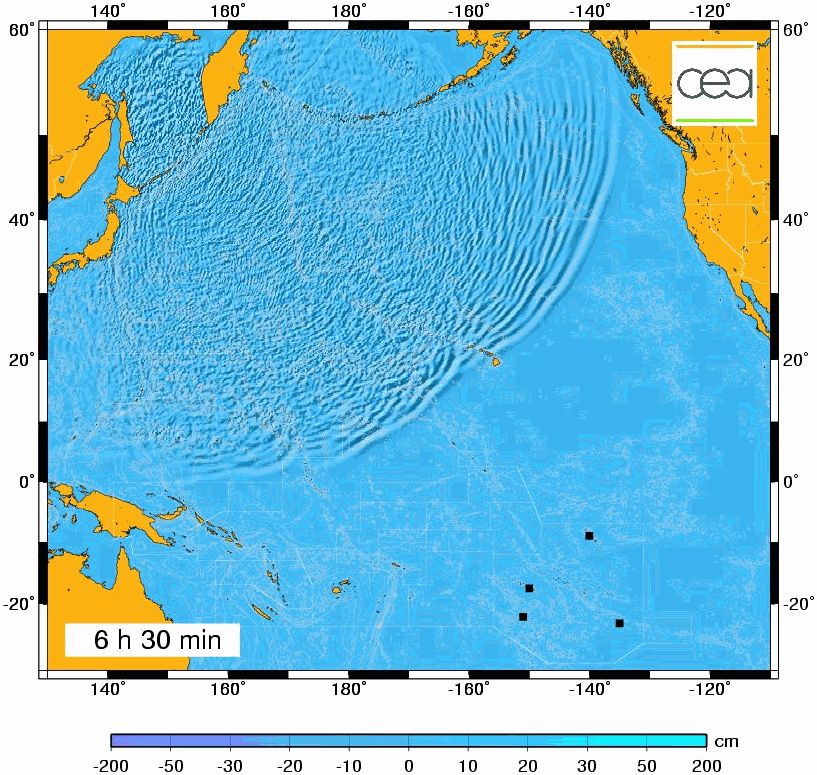
Figure 13: Animation of the state of the ocean surface obtained by simulating the tsunami.
Effects in French Polynesia
Based on local system assessment (TREMORS), a level 3 tsunami alert (roughly 1 meter high wave expected) was sent out to the authorities. Three hours before the arrival of the tsunami, the authorities issued recommendations to Marquesas Islands residents. The Polynesian tidal curves show that the tsunami is similar to the Marquesas Islands and Japan, with a maximum peak-to-trough height of about 90 cm in Taiohae (Figures 14 and 15). In Tahauku, amplitude reached about 60 cm. In Atuona, in the neighboring bay of Tahauku, the sea was seen to recede by 25-50 m. In Papeete (Tahiti), the tidal curve indicates an amplitude of about 30 cm.
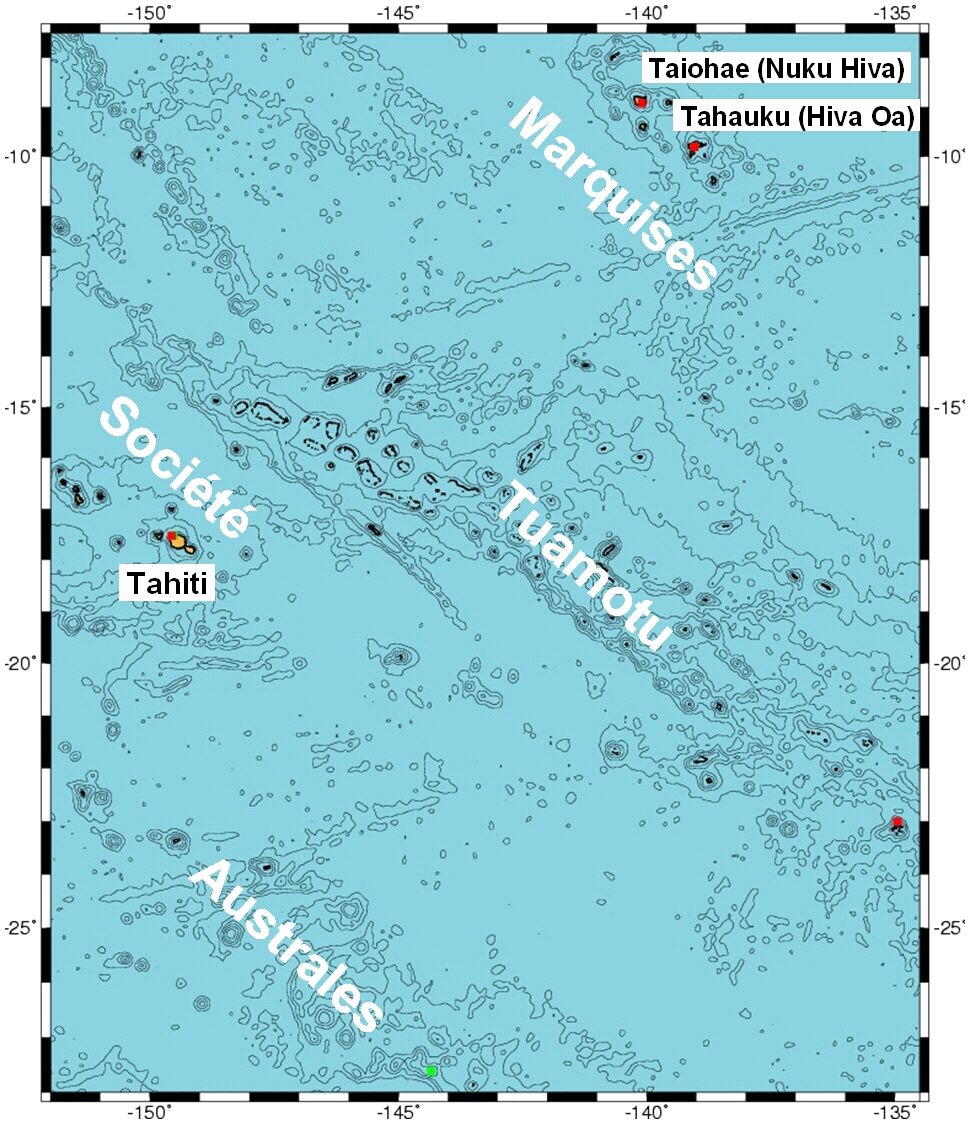
Figure 14: Map of Polynesia showing the position of tidal curve measuring points.
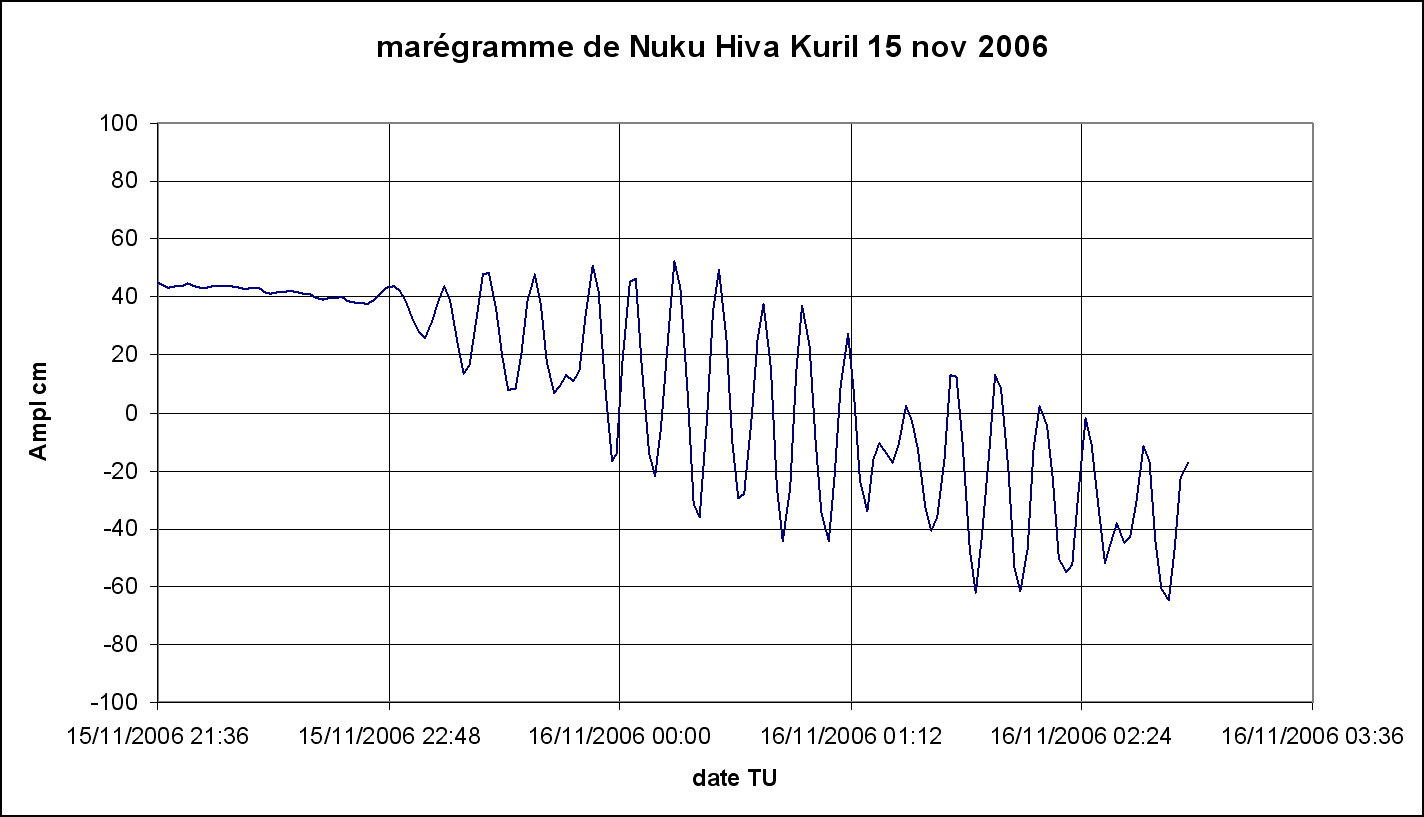
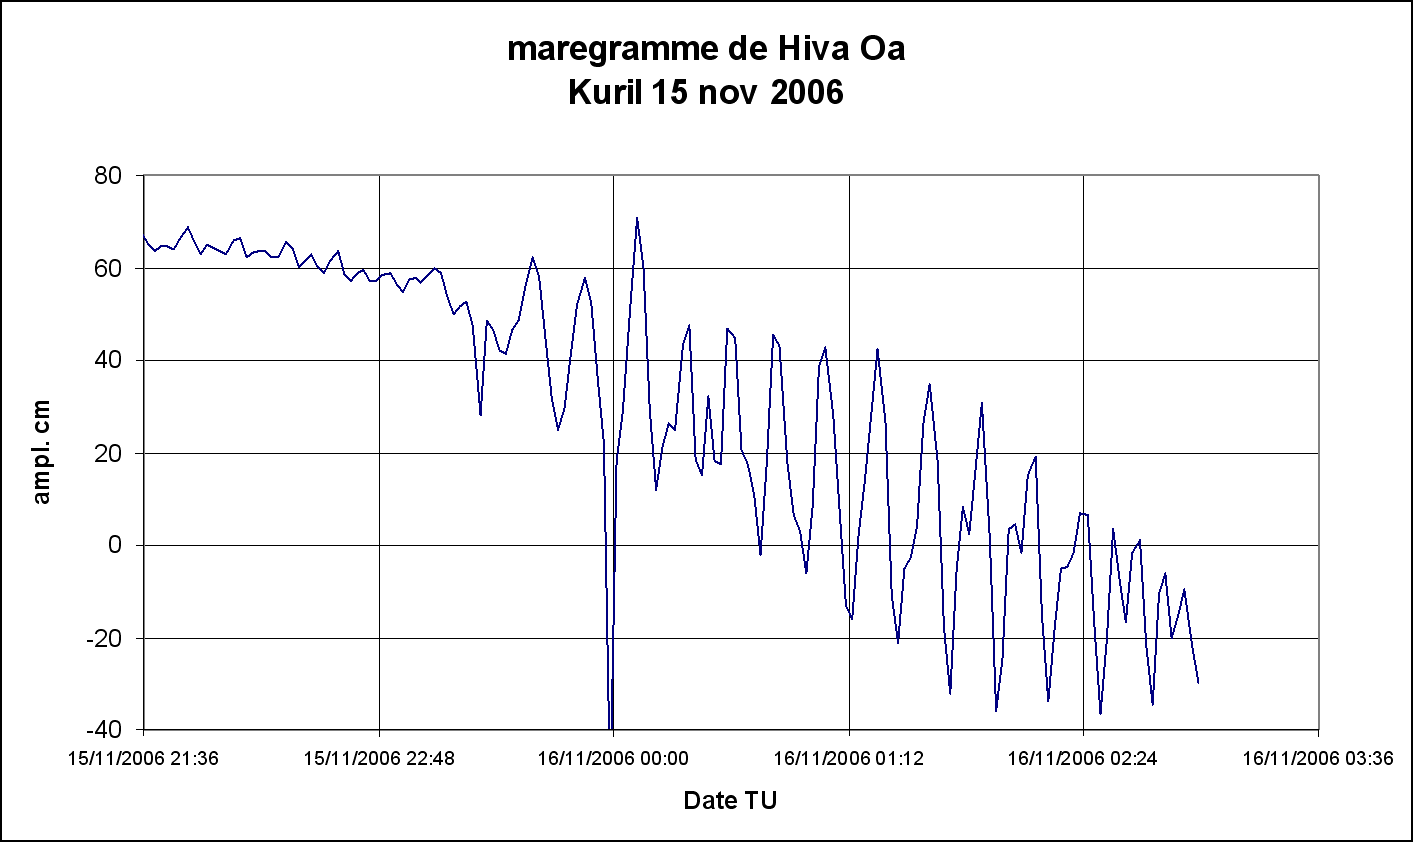
Figure 15: Tidal curves recorded in the Marquesas Islands, in the bays of Taiohae in Nuku Hiva (source PTWC/NOAA) and Tahauku in Hiva Oa (CEA/DASE- PTWC/NOAA). In Taiohae, amplitude is about 90 cm, and in Tahauku about 60 cm.
|
| |
|
|
|
)
)
)
)
)
)
)
)
)
)
)
)
)
)
)
)
)