| |

 |
Earthquake and Tsunami in the Solomon Islands, April 1, 2007
|
On April 1, 2007 at 8:39:56 pm UT, an Mw 8.1 magnitude earthquake occurred on the subduction zone in the Solomon Islands, a complex area involving both northeasterly convergence of the Australian plate beneath the Pacific plate, and also the presence of a microplate (Solomon plate) between these two major plates (Figure 1).
 Preliminary modeling of the seismic source Preliminary modeling of the seismic source
The first seismic waves (body waves) reached the mainland seismic stations at about 8:56 pm UT. But it was the surface waves that produced the highest amplitude - a displacement of about 0.5 mm (Figure 2). The P and S body waves recorded by 10 broadband stations located 3000 to 10 000 km from the earthquake are used to determine, by data inversion, the static parameters of the seismic source (focal mechanism, depth and rupture duration), as well as certain kinematic parameters (fault slip amplitude, rupture velocity). The results are shown in Figure 3.
The resulting geometric parameters are consistent with regional tectonics. The azimuth, dip and fault slip (respectively 316°, 27° and 110°) confirm an interplate subduction earthquake produced by convergence of the Australian plate north-east beneath the Pacific plate. Moreover, the shallow depth found (about ten kilometers) explains the formation of a tsunami, at least locally.
The distinguishing features of this earthquake are its duration (the rupture lasted a hundred seconds or so) and its horizontal extension along the subduction zone. The results of inversion underline the existence of two strong slip zones, one located at the hypocenter (star on Figure 1) where the local tsunami was strongest, and the other located 200 km north-west of this point (refer to these two areas in Figure 4). Note that the distribution of aftershocks confirms the existence of these two strong slip zones (Figure 5).
Nevertheless, these source duration and spatial extension values are not exceptional for an earthquake of this magnitude and are still well under those of the December 26, 2004 Sumatra earthquake, whose rupture had propagated for more than 1200 km in almost 10 minutes.
The tsunami
This earthquake produced a tsunami that was destructive on a regional scale. It hit Gizo Island, near the epicenter, and at least ten victims had been recorded 12 hours later. This number should increase as investigations continue, in particular on the more isolated islands (Mono, Choiseul). The heights recorded on Gizo Island are at least 3 meters, and 10 meters locally, with floods several hundred meters inland, making this a major tsunami.
The epicentral area is identified as a relative seismic gap, where no earthquake of such intensity had been recorded for at least a century. In addition, the only tsunamigenic earthquakes acknowledged around this gap did not result in teletsunamis capable of causing damage a long distance away (Figure 6).
An initial alert was issued by the PTWC (Pacific Tsunami Warning Center) about 15 minutes after the earthquake, with an estimated magnitude of 7.8. Messages then followed when the harbor tide gauge data became available, and magnitudes had been more accurately determined. The alert was eventually lifted 9 hours after the earthquake, following a watch organized on the east coast of Australia. The damage appears to be limited to the epicentral area.
Propagation in the south-west Pacific
The calculated propagation times (Figure 7) show that the Australian coasts were hit between 3 and 4 hours after the earthquake, while the Papua New Guinea Islands, situated closer by (Figure 8), must have been hit in 30 to 40 minutes. The latter islands were hit as they were located in the direction of maximum energy expected given fault orientation. Two-meter high waves were observed, which swept through several villages in the island of Rossel where at least 5 people were killed. In the island of Misima, thousands of people fled to higher land when they saw the waves starting to break over the shore and sweep boats and objects away.
Locally, opposite the seismic source, no tide gauge recordings were taken. The survivors mention an arrival time of the first wave 5 minutes after the earthquake, rising 3 to 4 meters high, and more than 10 meters locally. Dozens of villages were destroyed and a large number of people are expected to be missing. The tide gauge data alone (Figure 9) show regional amplitudes of 20 cm (on the island of Honiara, Solomon), and further afield a maximum amplitude of 11 to 15 cm, which corresponds to small long-distance effects. The tsunami remained confined to the area located between the Solomon Islands, Papua New Guinea and New Caledonia and consequently was insignificant thousands of kilometers away.
In New Caledonia, the authorities were alerted by the PTWC and the High Commissioner of the Republic decided to evacuate the Loyauté Islands and districts on the east coast as a precautionary measure. Evacuations to higher ground were accomplished and showed the alert procedure to be efficient. Water heights of 15 cm were observed.
Preliminary modeling
An initial simulation model of the tsunami on an oceanic scale confirmed that, for the fault assumed to cause the earthquake and for a magnitude of Mw 8.1, the maximum heights reached in deep ocean vary from 20 to 60 cm within 300 to 500 km of the source, then from 5 to 20 cm further away (Figure 10).
New Caledonia, as locally recorded observations confirm, was not located in the maximum energy lobe, but the simulation indicates that the islands north-west of Grande-Terre appear to have trapped some energy (Figure 10).
The fact that the relatively shallow waters associated with Lord Howe Rise, south of the Tasmanian Sea, trapped a significant amount of the tsunami's energy towards the south, is another interesting result (Figure 10). The Great Barrier Reef off Australia may therefore not have received all the potential energy. Furthermore it must have significantly reduced the amplitudes towards the Australian coasts.
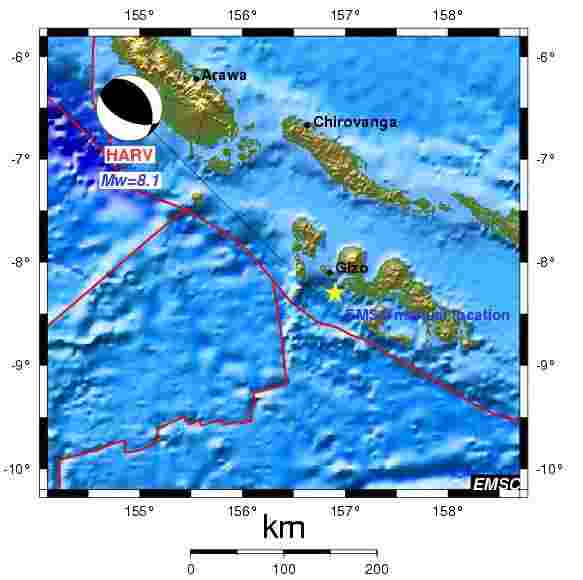
 Figure 1: Epicentral area around Gizo Island (Solomon), showing the focal mechanism determined by Harvard (source: EMSC). Figure 1: Epicentral area around Gizo Island (Solomon), showing the focal mechanism determined by Harvard (source: EMSC).
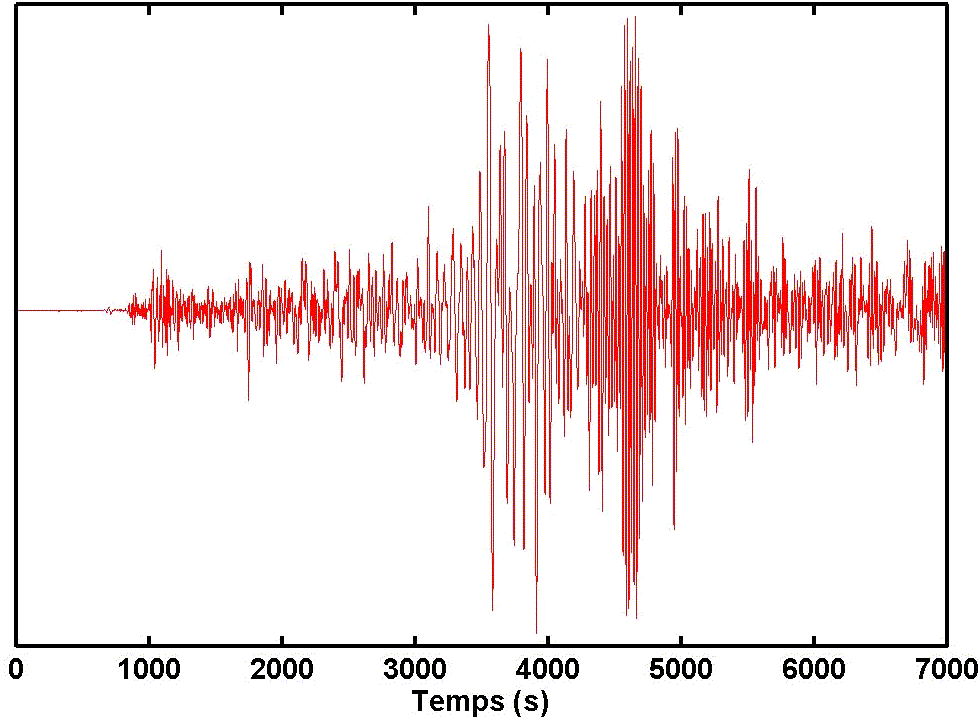
Figure 2: Seismic recordings obtained at the HAU station (Vosges). The maximum amplitude (about 0.5 mm displacement) was reached on the surface waves. The beginning of the recording corresponds to 8:45 pm UT.
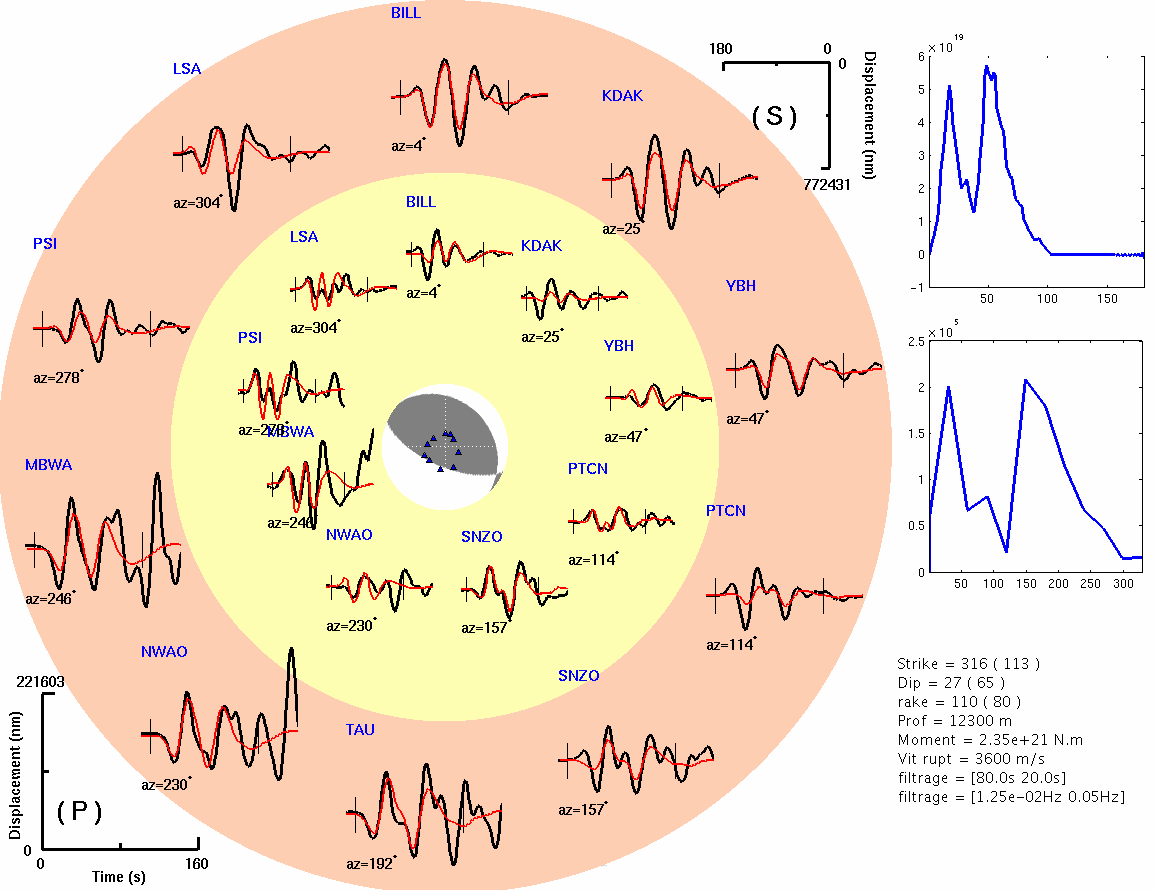
Figure 3: Rupture model and comparison of registered waveforms (black) and simulated ones (red) with filtering in the [80s-20 s] band. The SH teleseismic waves are shown in the yellow inner circle and the P teleseismic waves in the red outer circle. On the right side, the source functions in time (top) and space (center) emphasize the existence of two strong slip zones 50 s (in time) and about 200 km (in space) apart.
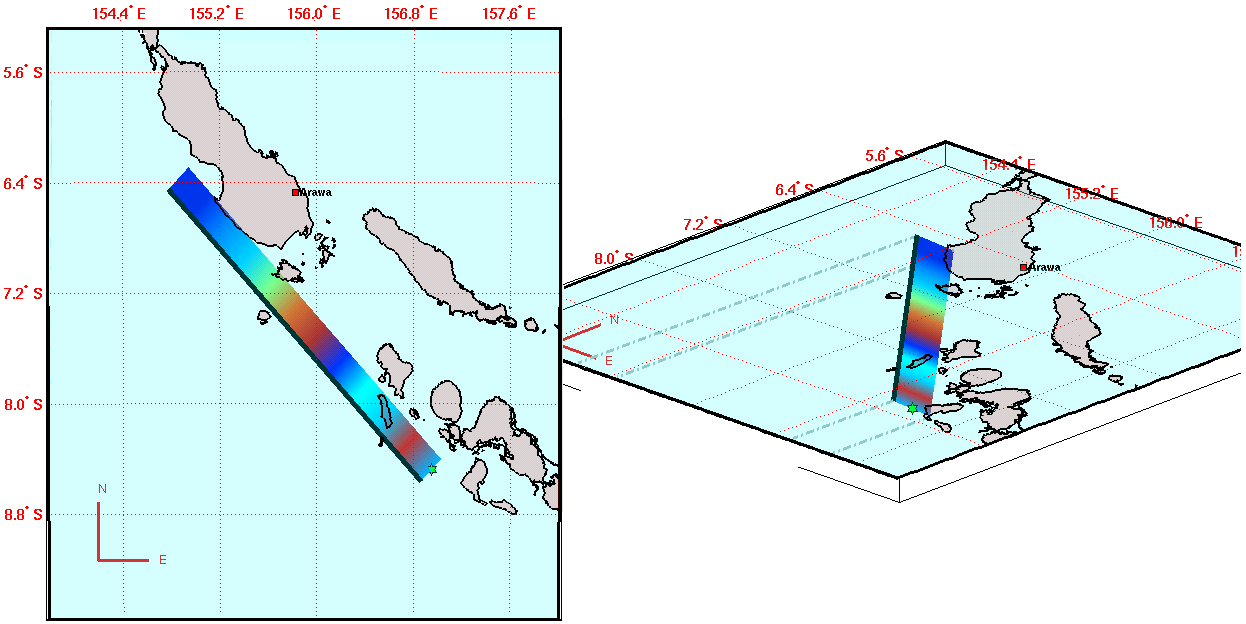
Figure 4: 2D and 3D representation of the fault slip. The areas where the slip is most significant are shown in red.
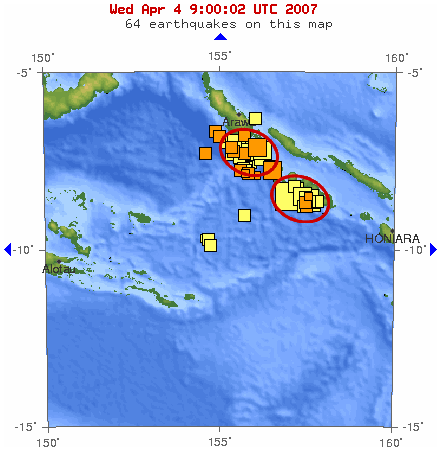
Figure 5: Distribution of aftershocks (taken from the USGS website), the hypocenter being represented by the largest yellow square. We can observe two relatively distinct seismicity swarms, in the areas of highest slip (red ellipses). The inversion results are thus confirmed.
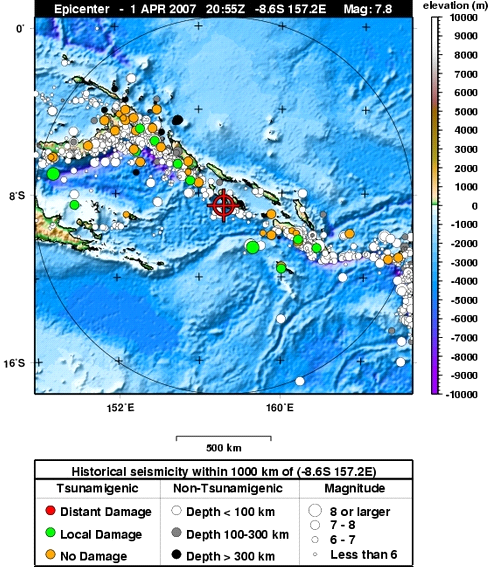
Figure 6: Tsunamigenic nature of regional historical earthquakes. The area of the 2007 earthquake is located in an area identified by a relative seismic gap (source: PTWC).
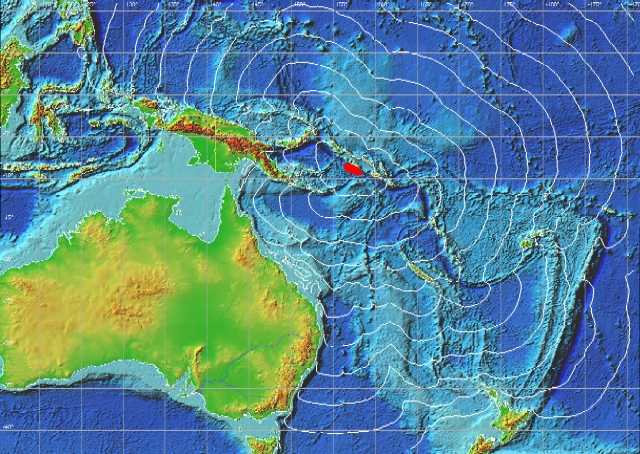
Figure 7: Tsunami travel time map. The isolines are plotted every 30 minutes. The Solomon Islands are hit within the few minutes following, and up to 30 minutes after, the earthquake. It took two hours for the tsunami to reach the northern tip of New Caledonia and three hours to reach Noumea and the south of the Loyauté Islands.
Figure 8: Area hit by the tsunami. The islands located in the red ellipse represent the area most affected by the tsunami (3 to 5 meter high waves). Given the direction of the rupture zone (N-W, S-E) and given the fact that the propagation path of the tsunami's maximum amplitude is essentially perpendicular, the islands south of Papua New Guinea are located in the potentially exposed area (orange). The photos represent damage in the Gizo Island area (source: AP).
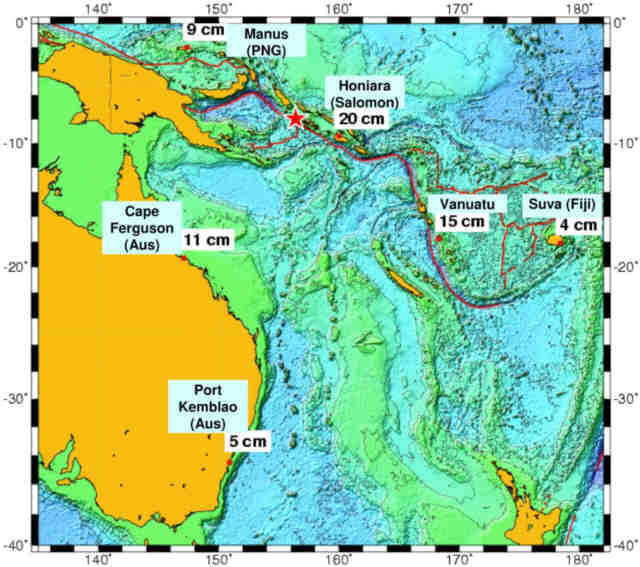
Figure 9: Tide gauge data available at the end of the alert (April 2, 2007 at 4 am UT).
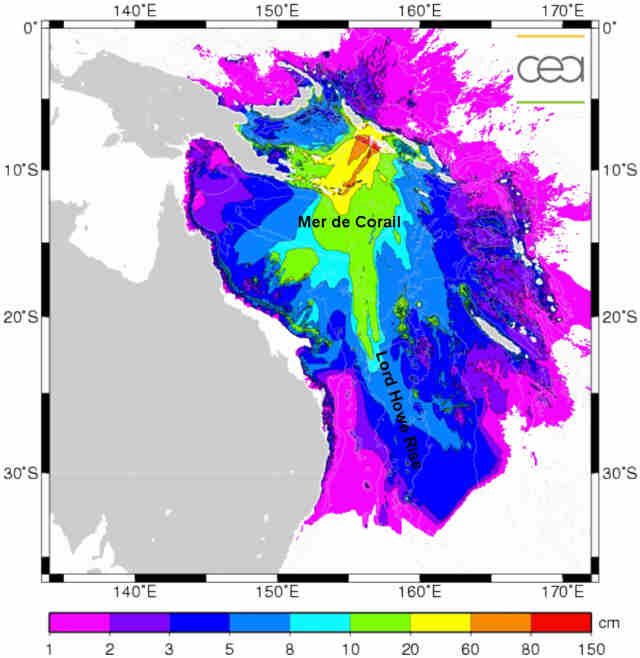
Figure 10: Simulation of the maximum water heights reached after 5 hours' propagation. The shallow waters south of the Tasmanian Sea appear to have captured a significant amount of the energy.
|
)
)
)
)
)
)
)
)
)
)
)
)