 |
 |
 |
|
 |
|
|
|
Scientific files |
|
|
| |
 |
Earthquake north of Sulawesi
16/11/2008 |
A violent earthquake of magnitude Mw 7.5 occurred on 16 November 2008 at 17:02:32 UCT, on the
subduction zone located to the North of central Sulawesi province, in Indonesia.
The seismo-tectonic setting of this zone is particularly complex, since it is at the junction of
three major plates: Eurasian, Indo-Australian and Pacific.
 Preliminary modelling of the seismic source Preliminary modelling of the seismic source
From the P and S body waves recorded on 10 broad-band stations at distances of 3 000 to 10 000 km
from the earthquake, we can use inversion to determine the static characteristics of the seismic source
(focal mechanism, depth and duration of the rupture), as well as certain kinematic parameters
(amplitude of fault slip, rupture velocity).
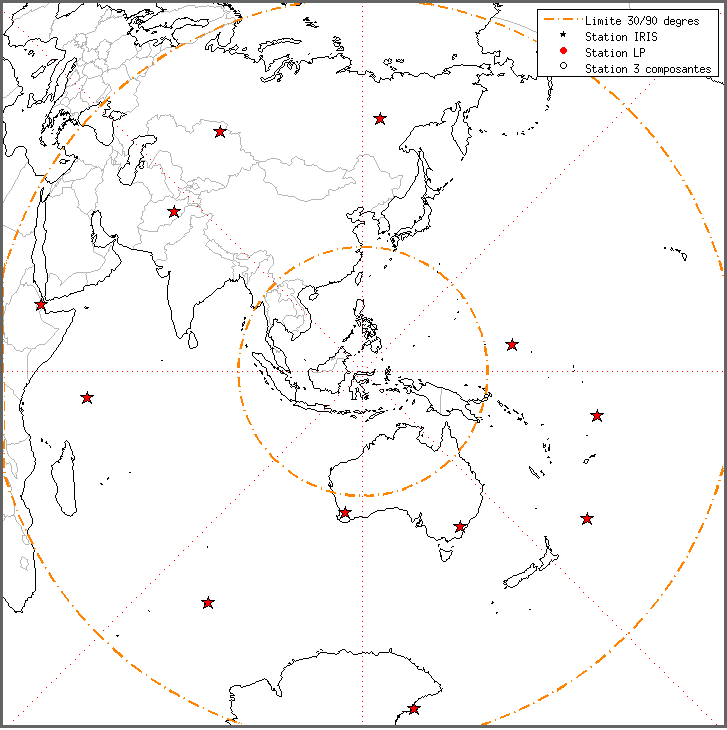
 Figure 1: Map showing the 12 broadband IRIS stations centred on the event, which were used for
determination of the seismic source. Figure 1: Map showing the 12 broadband IRIS stations centred on the event, which were used for
determination of the seismic source.
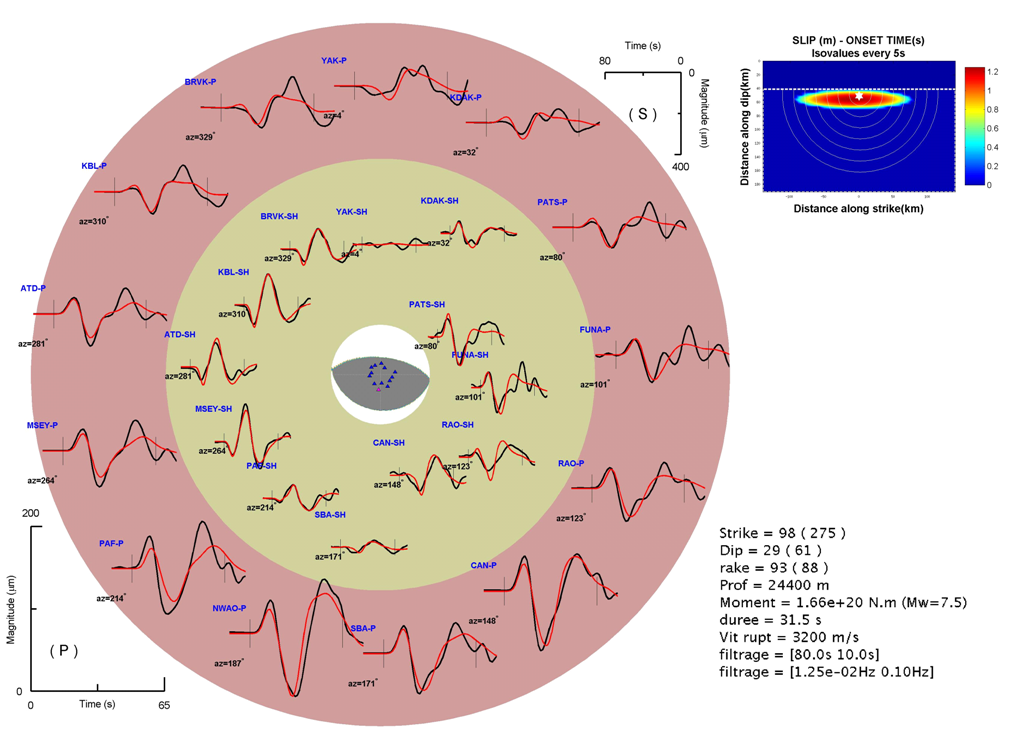
Figure 2: Rupture model and comparison of waveforms, with recorded signals in black and simulated signals in
red, using data filtered in the [80s 10s] band. Teleseismic SH waves are represented in the yellow inner circle and teleseismic P waves
in the red outer circle. Box on right shows the elliptical distribution of fault slip obtained by the method of patches.
The geometrical parameters obtained are coherent with regional tectonics: the strike, dip and fault slip (98°, 29° and 93° respectively) indicate an inter-plate subduction earthquake.
The amount of fault slip (maximum of approximately 1.3 m) and its horizontal extension (approximately
150 km) could have induced a regional tsunami, but the relative depth of the hypocentre (25 km)
fortunately limited the vertical displacement of the ground immediately above the earthquake focus.
The rupture was bilateral and propagated for approximately 30 s over a distance of little more than 100 km
on either side of the hypocentre.
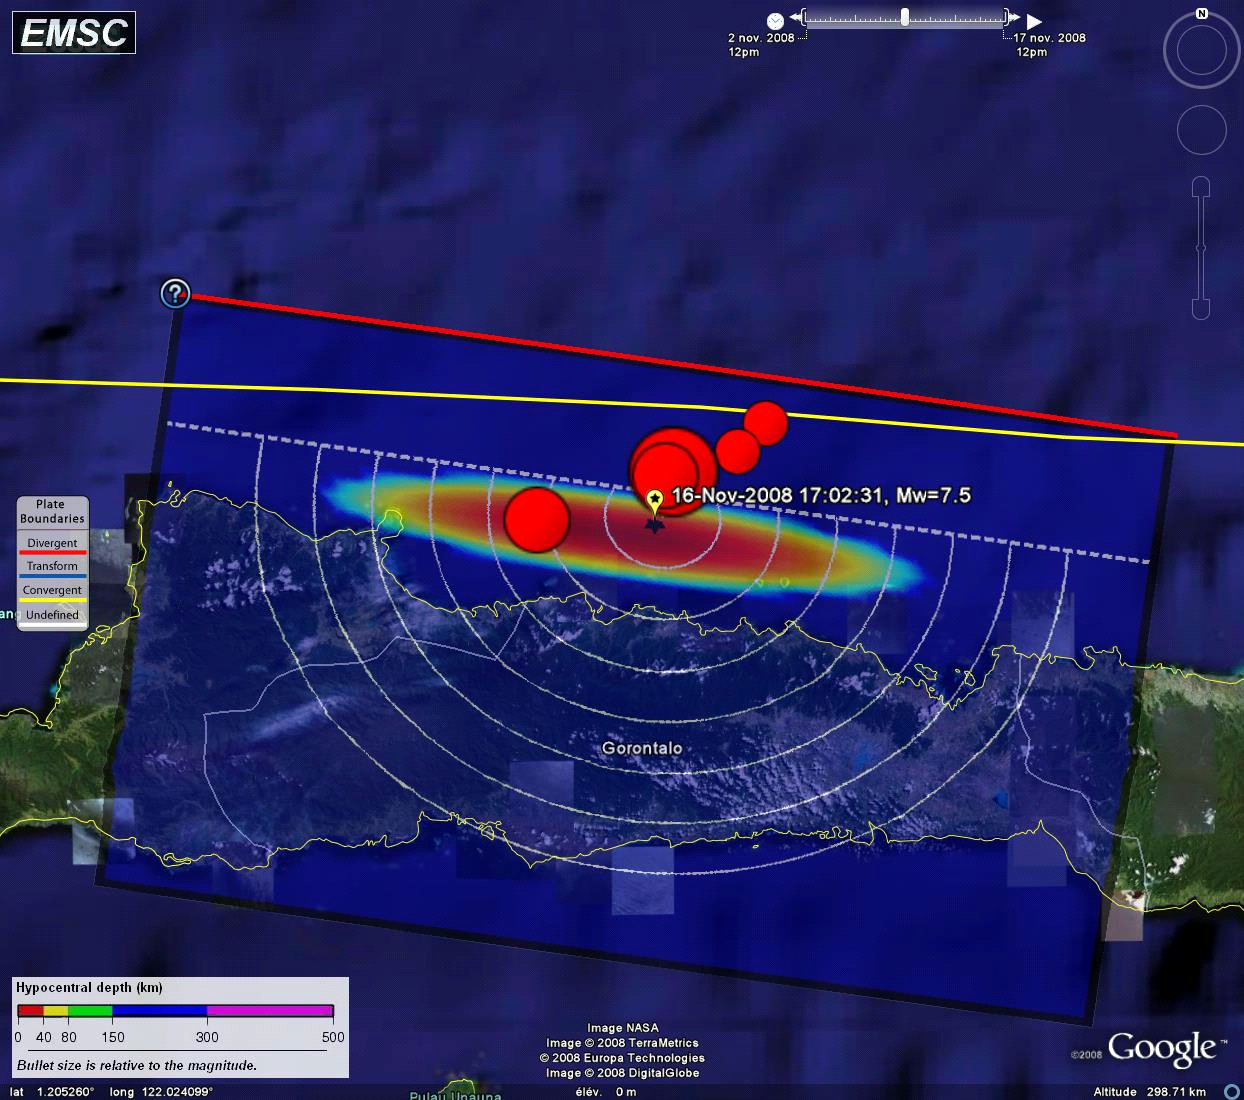
Figure 3: Distribution of fault slip and aftershocks with magnitudes greater than 5 (EMSC). The aftershock zone is
consistent with the calculated areas of slip (or slip patch) and the adopted fault plane.
Modelling of the displacement induced on the surface
From the displacement determined on the fault, the displacement induced at the surface can be estimated using
the formulation of Okada (1985) for a homogeneous elastic half-space. In the present case, vertical displacement at
the epicentre should not have exceeded about 30 cm.
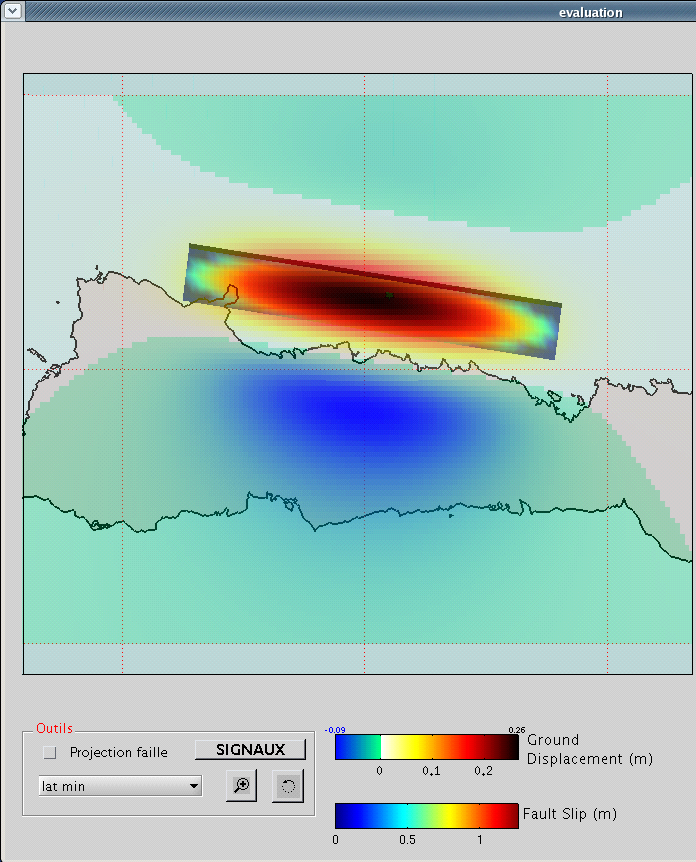
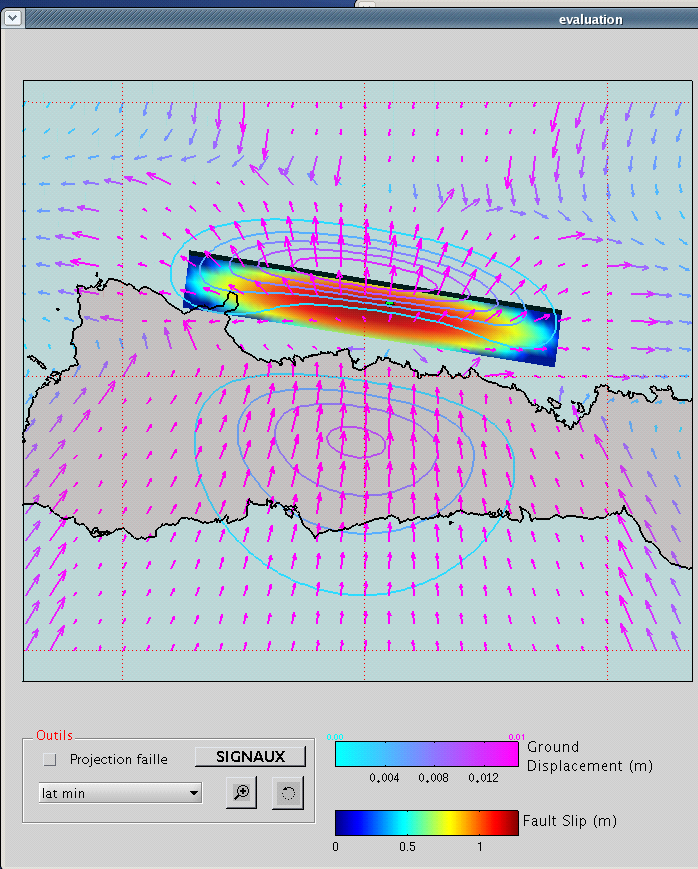
Figure 4: Distribution of the static ground displacement (on left: vertical, on right: horizontal) in a radius of 300 km
around the epicentre. The colour coding at the bottom indicates displacement on the fault, whereas the colour
coding at the top gives vertical and horizontal ground displacements.
Vertically above the focus, the seafloor was raised by about 30 cm, whereas the island underwent a subsidence of
10 cm.
Horizontal displacements remain weak since they do not exceed a maximum of 15 cm.
Calculation of times of arrival of the tsunami
Theoretical times of arrivals of the tsunami are calculated using the code ttt (Tsunami Travel Time
developed by Dr. Paul Wessel,
http://www.geoware-online.com) and of GMT (Generic Mapping Tools
developed by Drs. Paul Wessel and Walter Smith,
http://gmt.soest.hawaii.edu).
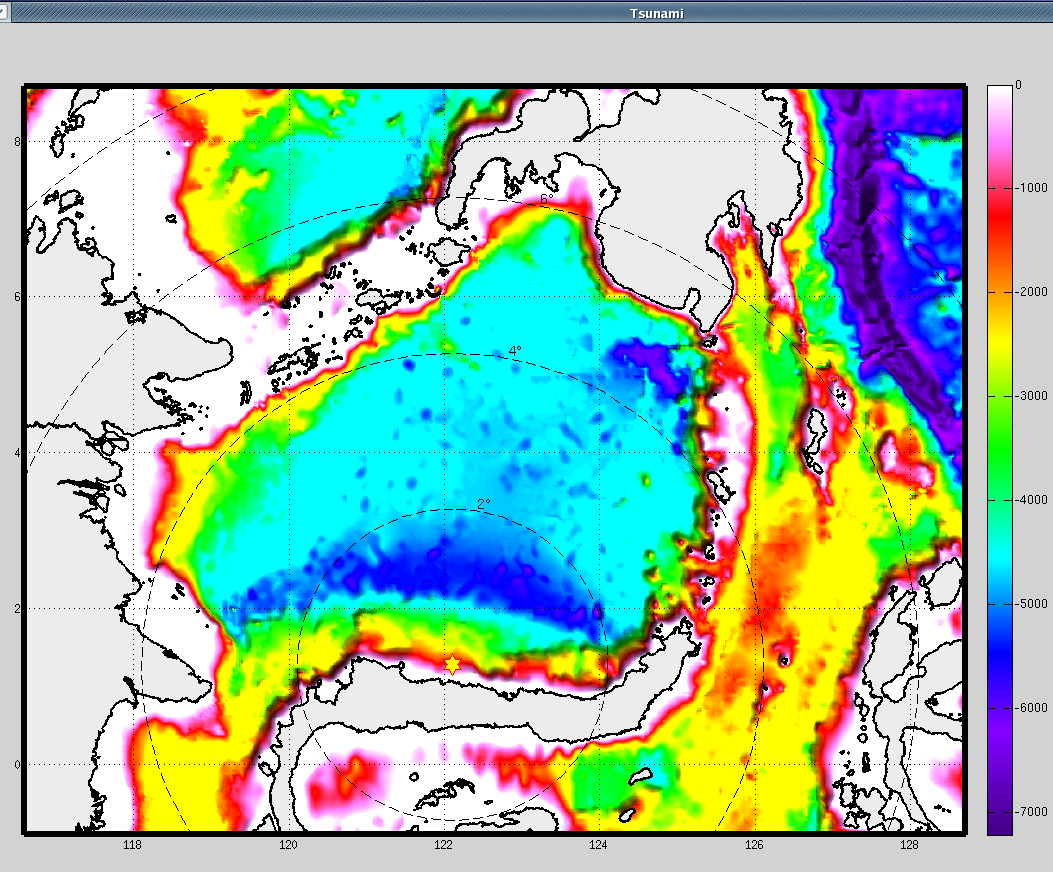
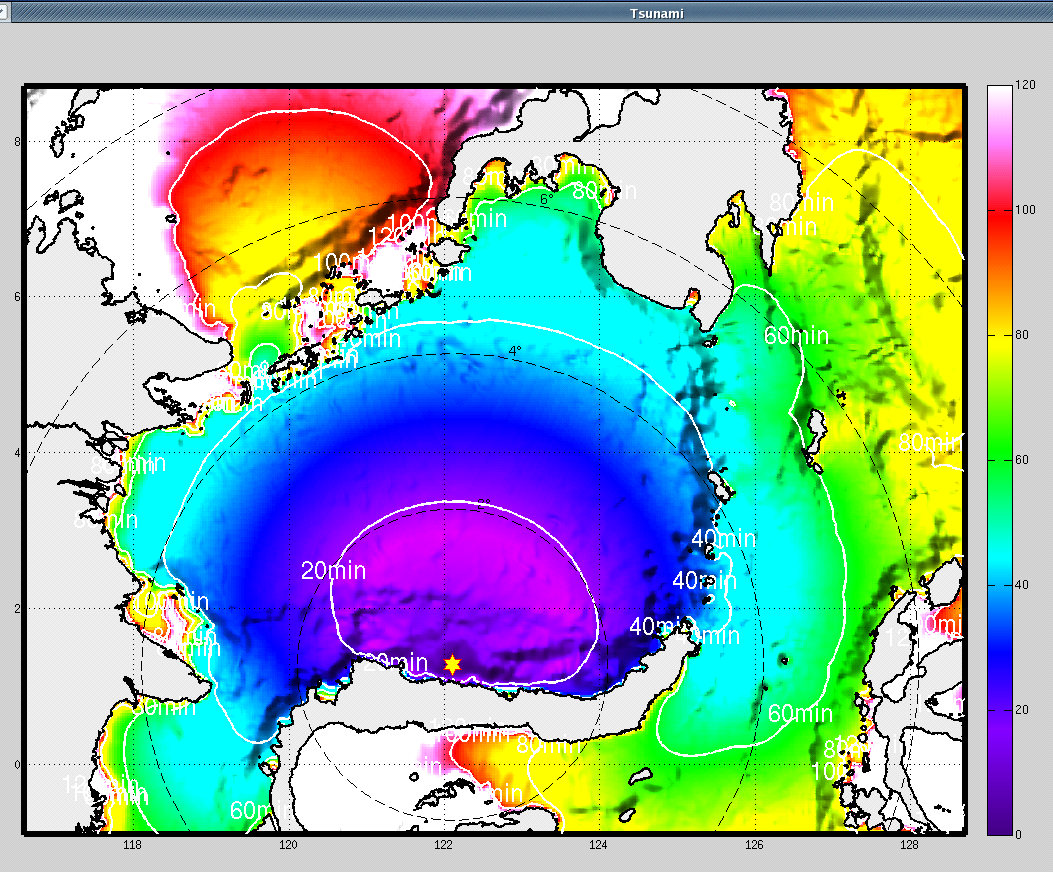
Figure 5: Bathymetry (on left) and tsunami travel time (on right) in the area around the earthquake.
Whereas the closest coastlines are struck after less than 10 minutes, other islands are more exposed,
being located directly north of the earthquake, and are affected approximately 1 hour later.
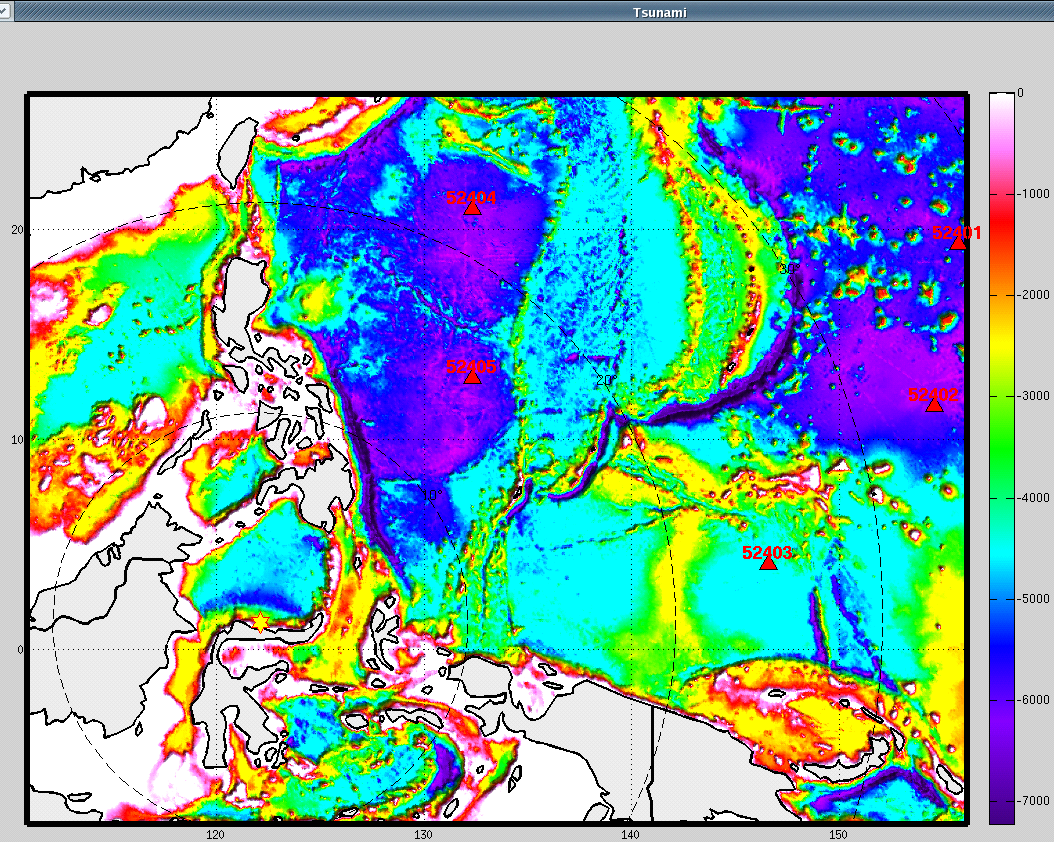
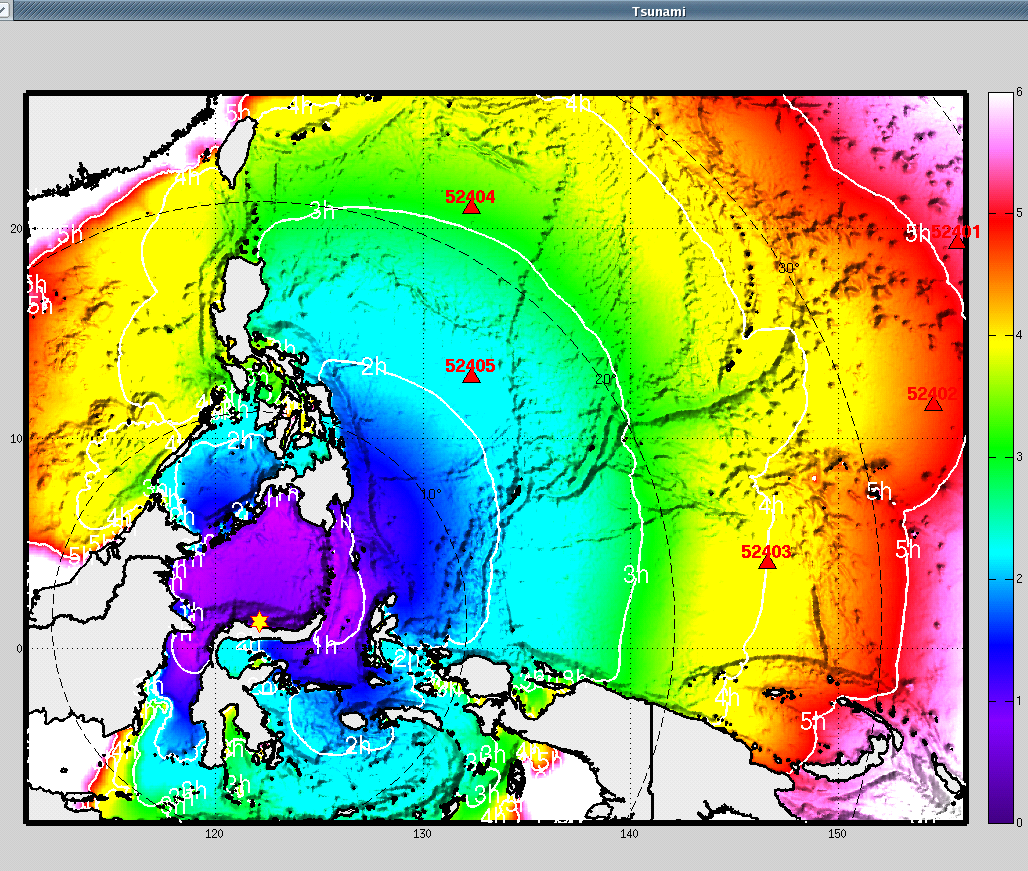
Figure 6: Bathymetry (on left) and tsunami travel time (on right) in a radius of
4000 km around the earthquake focus. The red triangles indicate DART buoys measuring the
tsunami amplitude in the open sea.
The sea in which the earthquake occurred is almost closed, which explains why the tsunami had
little chance of being propagated into the Pacific. However, It would be interesting to model the
tsunami amplitudes with the source obtained to allow an eventual comparison with waveforms
recorded by the three DART buoys 52403, 52405 and 52404.
|
|
|
)
)
)
)
)
)
)
)
)