 |
 |
 |
|
 |
|
|
|
Scientific files |
|
|
| |
 |
Earthquake of magnitude Mw=8.2 in the Samoa Islands (Pacific)
29 September 2009 |
 Description of the earthquake Description of the earthquake
An earthquake of strong magnitude took place on 29 September at 17h48 UTC 160 km south of the islands of Siumu and Apia (Samoa Archipelago) (Figure 1). This earthquake was strongly felt over the whole of Samoa and generated a tsunami which gave rise to a Pacific-wide alert. On the Samoa Archipelago, the local tsunami claimed a death toll of 113 (estimate on 1 October 2009).
The characteristics of this earthquake are given in the table below.
| Date |
29 september 2009 |
| Heure
origine |
17h 48 min 11 s UTC |
| Latitude |
15.42° South |
| Longitude |
172.13° West |
| Depth |
10 km |
| Magnitude |
8.0 (Mw estimated from P and SH waves)
8.2 (Mw estimated from Rayleigh and Love waves at the CPPT) |
|
The CPPT (Centre Polynésien de Prévention des Tsunamis -French Polynesia Tsunami Warning Center) is a laboratory of the CEA located on Tahiti. It is responsible for alerting civil safety in the event of strong earthquakes likely to generate tsunamis in French Polynesia.
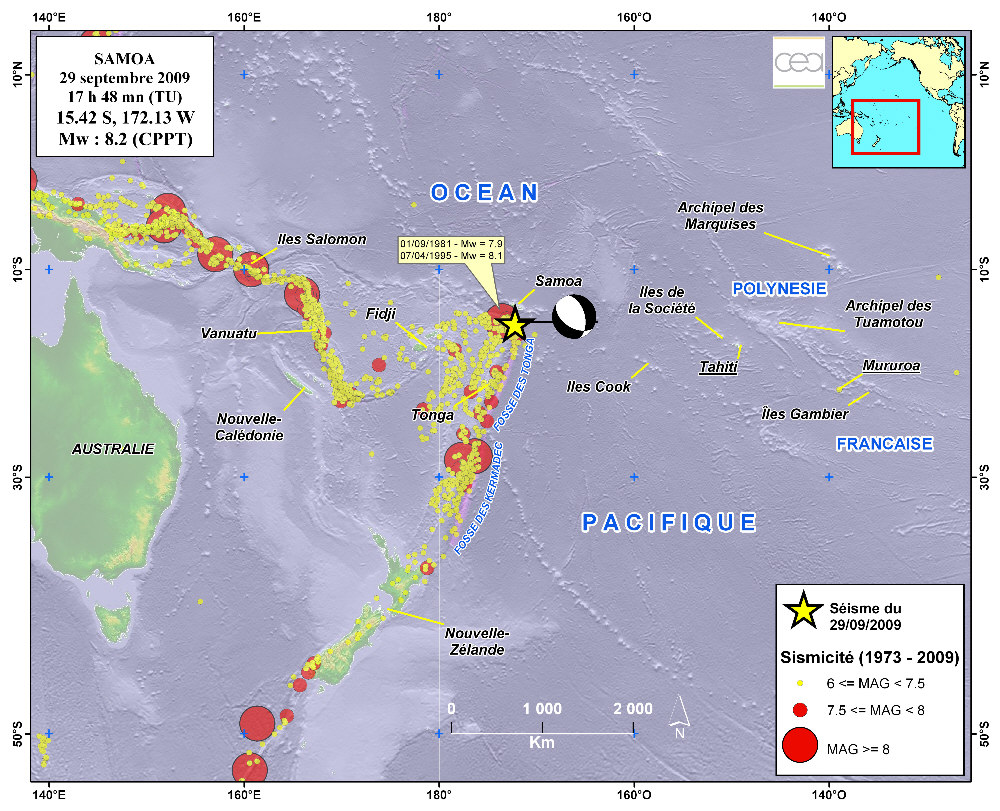
 Figure 1: Map location of the event (data source: CEA/DAM) Figure 1: Map location of the event (data source: CEA/DAM)
A local tsunami alert was immediately issued by the Pacific Tsunami Warning Center (PTWC) for all areas of the Pacific Ocean. In French Polynesia, the alert was given and followed up by the CPPT of Tahiti.
Seismo-tectonic context
The earthquake of 29 September 2009 is in the tectonic region of Tonga (Pacific). The tectonic context of this region is dominated by the relative convergence of the Australian and Pacific plates. This latter plate is being subducted under the Australian plate along the Tonga trench. At the level of the epicentre, the velocity of relative convergence of the two plates is estimated at between 86 and 236 mm/year. This boundary zone between the Australian and Pacific plates is one of the most seismically active areas in the world.
Kinematic inversion (preliminary results)
This estimation involves reproducing seismic recordings at great distances from the epicentre by reconstructing the rupture history using the method of patches (Vallée and Bouchon: Imaging co-seismic rupture in far-field by slip patches, JGI, 2004). For this purpose, we reconstruct the displacements of the compressional (P) and shear (SH) body waves to achieve a better forcing of the seismic source.
The kinematic inversion using long-period data (CEA and IRIS) from seismic sensors yields a normal-fault focal mechanism, a magnitude of Mw=8.0 and a focal depth of 10 km (Figure 2). The length of the rupture zone is estimated at 80 km, with an average slip on this zone of about 10 m.
These are preliminary scientific results which are likely to be modified according to the input of new data and the choice of a different fault plane.
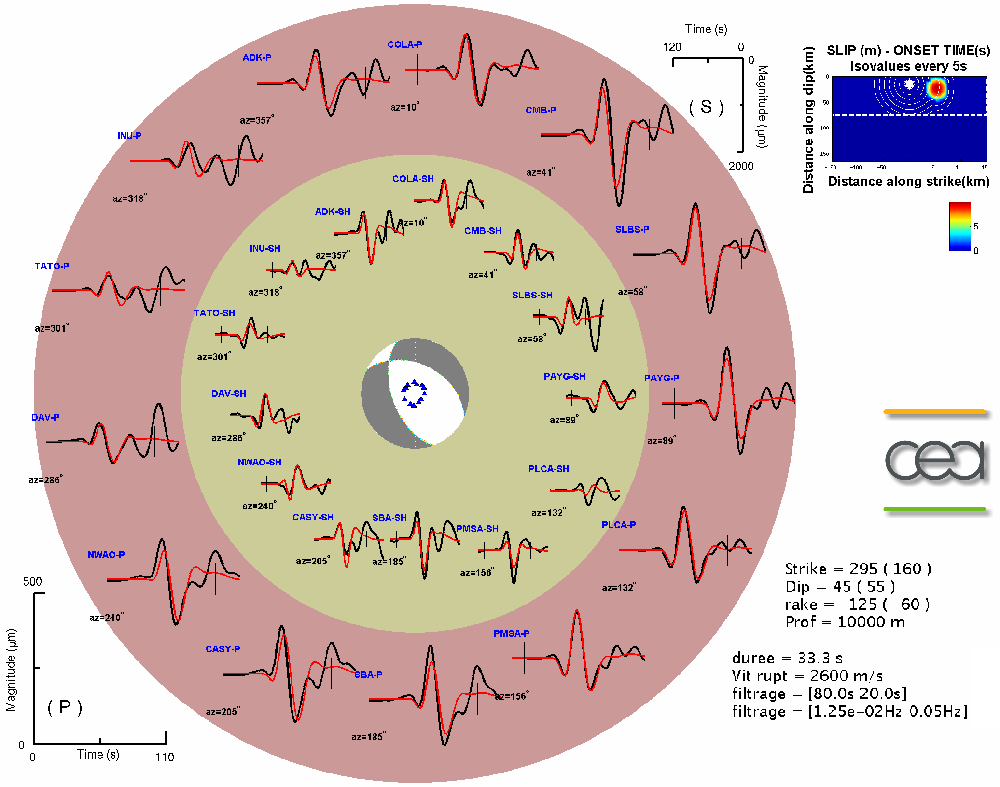
Figure 2: Inversion of the P and SH body waves yields a magnitude of Mw=8.0 with two slip zones. The rupture on the fault is at a depth of 10 km (data source: CEA-DAM).
Figure 3 below shows the slip obtained by inversion, in the geographical context of the region.
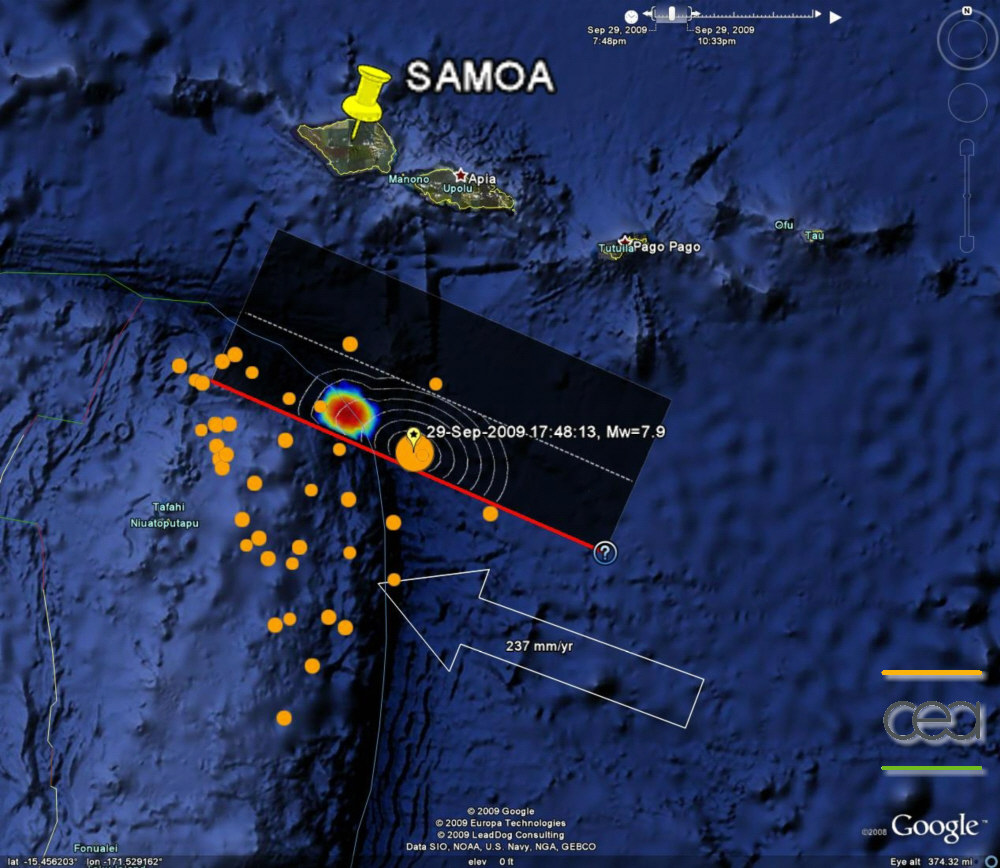
Figure 3: Map showing location of the slip zone (multicoloured ellipse), fault plane (black rectangle) and positions of the seismic aftershocks (orange circles) (data source: CEA-DAM).
For such strong-magnitude events (Mw>8.0), it is necessary to validate the magnitude by using the surface waves to study the whole of the spectrum. The inversion of the Love and Rayleigh waves carried out at the CPPT (Tahiti) yields an estimated magnitude of Mw=8.2 (Figure 4).
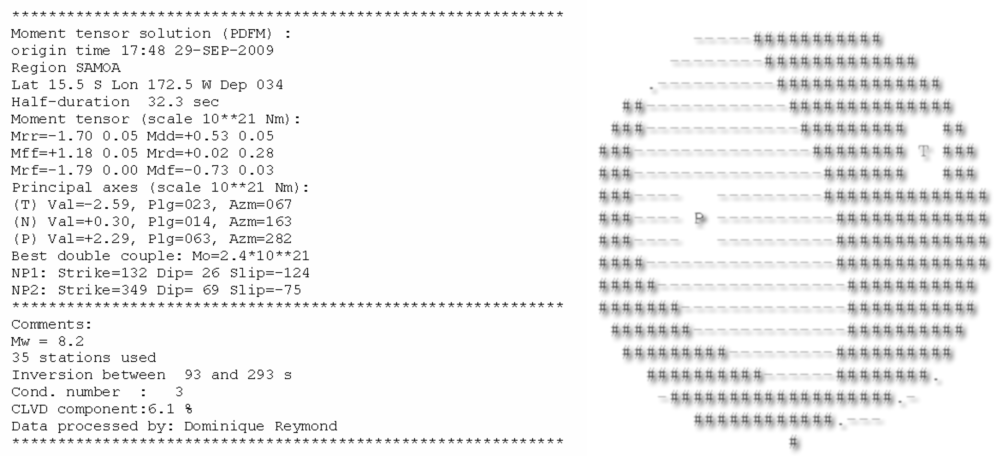
Figure 4: Result of seismic source analysis based on surface waves (data source: CEA-CPPT).
Tsunami generated by the seism
Figure 5 shows the theoretical times of arrival of the tsunami, calculated using the code ttt (Tsunami Time Travel developed by Dr Paul Wessel, http://www.geoware-online.com) and GMT (Generic Mapping Tools developed by Drs Paul Wessel and Walter Smith, http://gmt.soest.hawaii.edu).
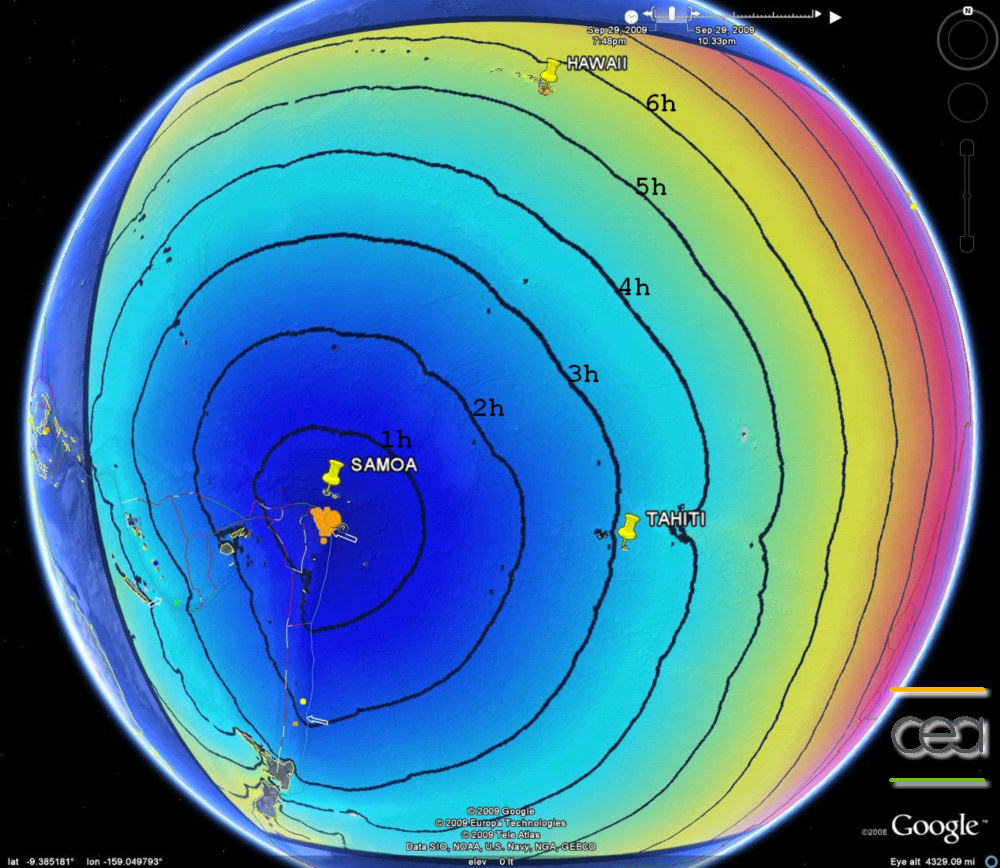
Figure 5: Position of the earthquake epicentre (arrow), aftershocks (orange circles), and theoretical travel time of the tsunami over the whole of the Pacific Ocean (data source: CEA-DAM).
Wave heights of several metres were recorded in the Samoa Archipelago.
The tide-gauge stations at Pago Pago and Apia recorded exceptional wave heights, with Peak-to-peak (CC) amplitudes of 4.4 and 1.4 m, respectively (see Figure 6).
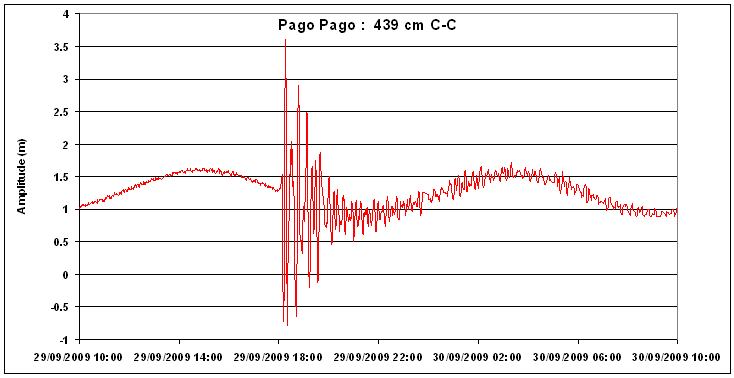
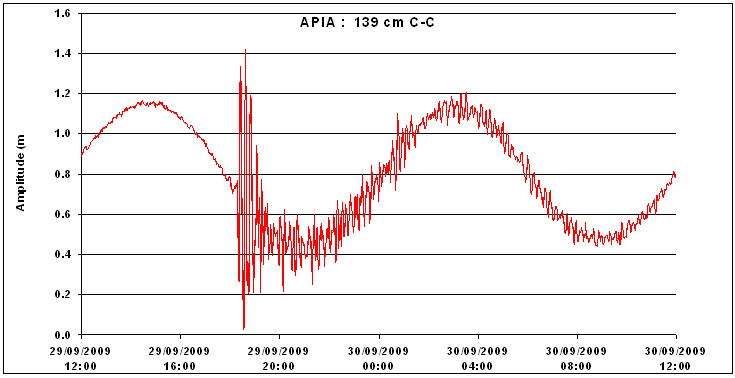
Figure 6: Peak-to-peak amplitudes of tsunami recorded at the Pago Pago and Apia tide-gauge stations in the Samoa Islands (data source: CEA-CPPT).
In French Polynesia, the maximum amplitude was recorded at Nuku Hiva (0.9 m CC) and Hiva Oa (0.8 m CC), in the Marquesas Islands. At Rangiroa, in the Tuamotu Archipelago, an amplitude of 0.4 m CC was measured by a tide-gauge very recently installed by the University and the SHOM. At Papeete, the measured amplitude was 0.3 m CC (Figure 7).
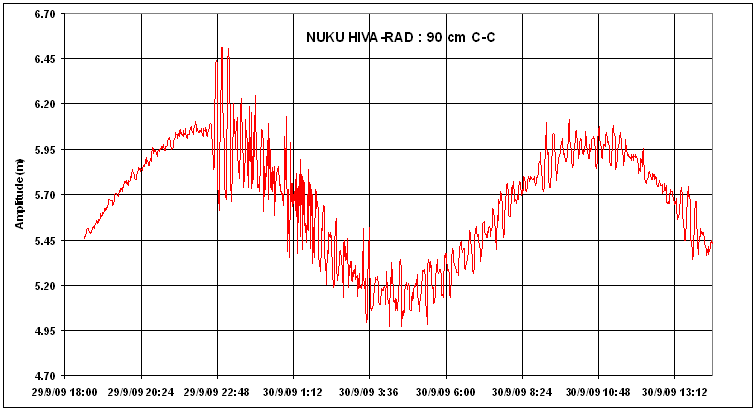
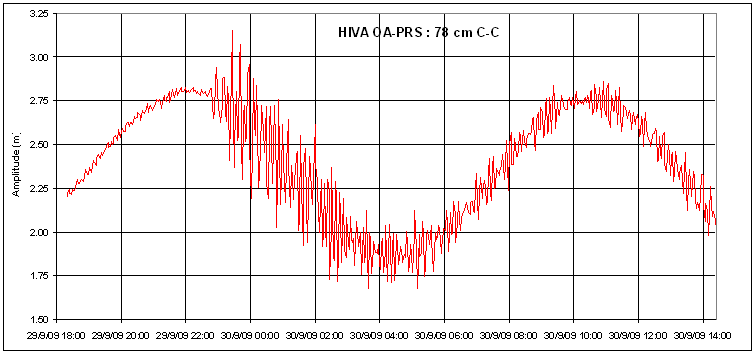
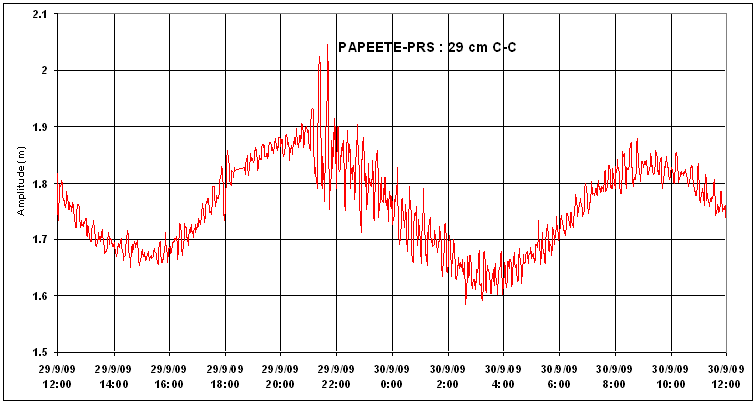
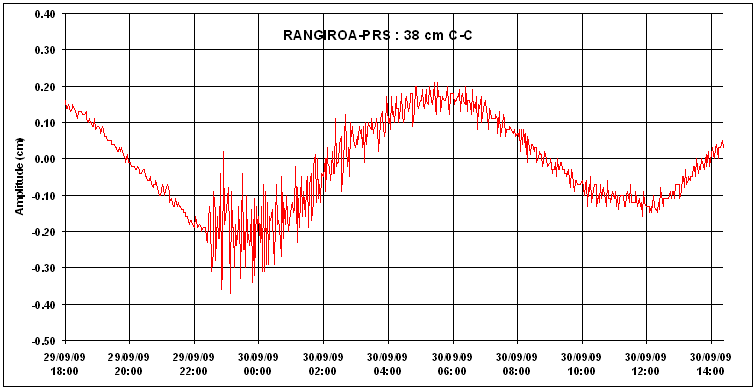
Figure 7: Peak-to-peak amplitudes of the tsunami recorded in the Marquesas Islands (Nuku Hiva and Hiva Oa), Tahiti (Papeete) and Rangiroa (Tuamotu Archipelago) (data source: CEA-CPPT).
|
|
|
)
)
)
)
)
)
)
)
)
)
)