| |


|
Magnitude Mw=8.8 earthquake in Chile (115 km NNE of Concepción) on 27 February 2010 and Pacific-wide tsunami |
This earthquake occurred on a strongly seismic zone located at the boundary between the Nazca and South American tectonic plates. The rate of convergence of these two plates is estimated at 8 cm per year.
This very strong magnitude earthquake was located at sea and thus generated a major tsunami that crossed the whole of the Pacific Ocean, with notable effects in Japan 23 hours after the shock, where wave heights of 1.20 to 1.50 m were locally observed causing floods.
 Description of the earthquake Description of the earthquake
An earthquake of very strong magnitude took place on 27 February 2010 offshore from Maule in Chile. This earthquake was strongly felt over the whole of Chile, and generated a major tsunami. At the present time (1 March at 12h) the local press is giving a preliminary estimate of about 700 dead and 2 million disaster victims.
| Date |
27 February 2010 |
| Onset time |
06 h 34 GMT (03h 34 local time) |
| Latitude |
35.85° South |
| Longitude |
73.04° West |
| Depth |
30 km |
| Magnitude |
8.7-8.8 (Mw estimated by CEA/DAM) |
|
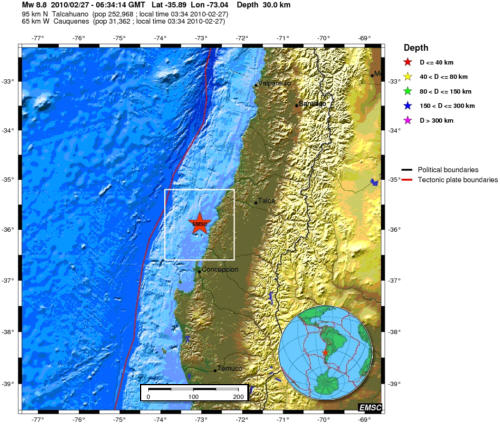
 Figure 1: Map showing location of the event (source : CSEM). Figure 1: Map showing location of the event (source : CSEM).
A local and trans-Pacific tsunami alert was immediately issued by the Pacific Tsunami Warning Center (PTWC) on Hawaii and the Japan Meteorological Agency (JMA), as well as by LDG-Pamataï on Tahiti for the French islands of the Pacific.
This note aims to present the seismo-tectonic context as well as the preliminary results of the study of the source of the earthquake and the tsunami.
Seismo-tectonic context
This earthquake occurred on a strongly seismic zone located at the boundary between the Nazca and South American plates. The rate of convergence of these two plates is estimated at 8 cm per year.
Chile is one of the most seismically active areas on Earth. The greatest magnitude historical earthquakes are located in this region, including the magnitude-9.5 event of 1960 that occurred 230 km south of the present shock, representing the strongest earthquake recorded for 200 years. Since 1973, more than 13 events of magnitude greater than 7.0 have been located on the Chilean coast. The earthquake of 27 February is located within a zone extending between the magnitude-9.5 shock of 1960 and the magnitude-8.5 shock of 1922. These two major earthquakes are reported not only as having caused tsunamis locally on the Chilean coast, but also deadly trans-Pacific tsunamis.
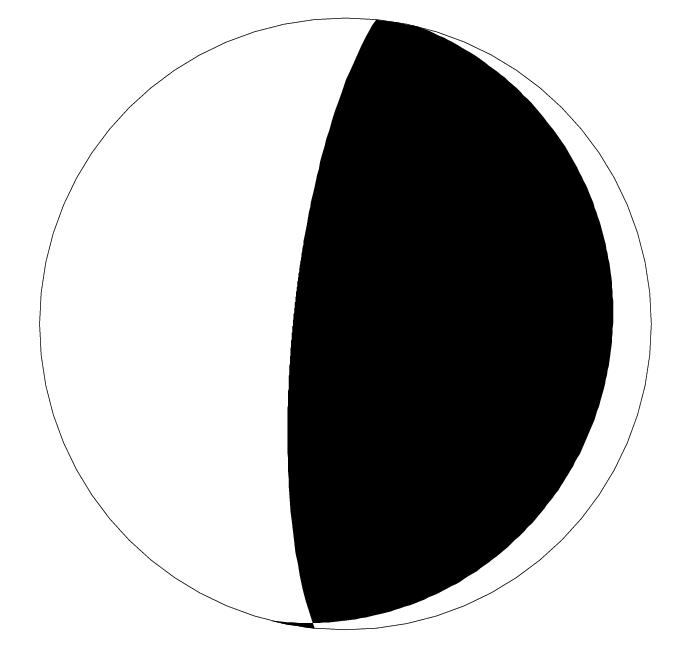
PDFM moment tensor inversion
Moment tensor solution (PDFM):
origin time 06:34 27-FEB-2010
Region CHILE
Lat 35.8 S Lon 72.7 W Dep 035
Half-duration 64.6 sec
Moment tensor (scale 10**22 Nm):
Mrr=+0.91 0.06 Mdd=-0.06 0.06
Mff=-0.85 0.06 Mrd=-0.15 0.00
Mrf=-1.73 0.00 Mdf=-0.14 0.03
Principal axes (scale 10**22 Nm):
(T) Val=-1.94, Plg=059, Azm=093
(N) Val=-0.04, Plg=002, Azm=186
(P) Val=+1.97, Plg=031, Azm=277
Best double couple: Mo=2.0*10**22
NP1: Strike= 14 Dip= 14 Slip= 98
NP2: Strike=185 Dip= 76 Slip= 88
********************************************
Comments:
Mw = 8.8
20 stations used
Inversion between 146 and 292 s
Cond. number : 5
CLVD component:0.9 %
Variance reduction: 64.9 %
Data processed by: Dominique Reymond
********************************************
|
 |
Kinematic inversion
This estimation involves reproducing seismic recordings at great distances from the epicentre by reconstructing the rupture history using the method of patches (Vallée and Bouchon: Imaging co-seismic rupture in far-field by slip patches, JGI, 2004). For this work, we reconstruct the displacements of the compressional (P) and shear (HS) body waves to achieve a better forcing of the seismic source.
The kinematic inversion using long-period data (CEA and IRIS) from seismic sensors yields a reverse-fault focal mechanism, a magnitude of Mw=8.7-8.8 and a focal depth of 30-40 km. The length of the rupture zone is estimated at more than 600 km, with a maximum slip of 4 m locally.
These are preliminary scientific results which are likely to be modified according to the input of new data and the choice of a different fault plane.
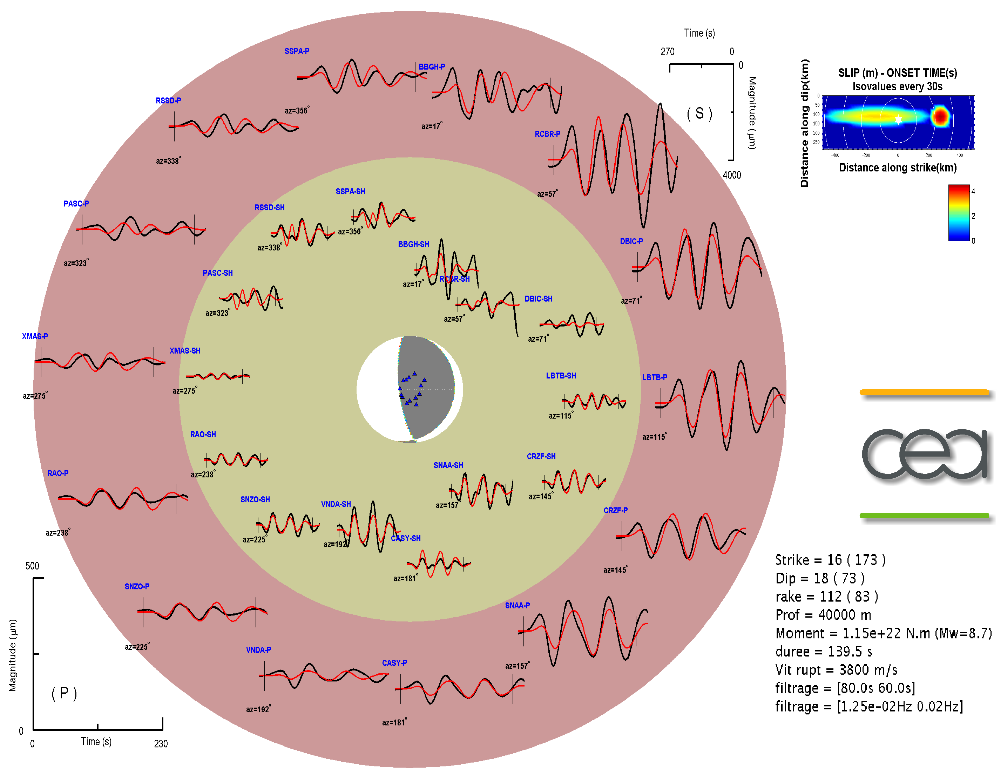
Figure 2: The inversion leads to a magnitude of Mw=8.7 with a zone of slip. The rupture on the fault extends over a length of between 550 and 650 km (source: CEA/DAM).
Figure 3 below shows the slip obtained by the inversion as well as a comparison with the geographical location of the aftershocks. We observe a good correlation between the zones undergoing slip and the location of the aftershocks.
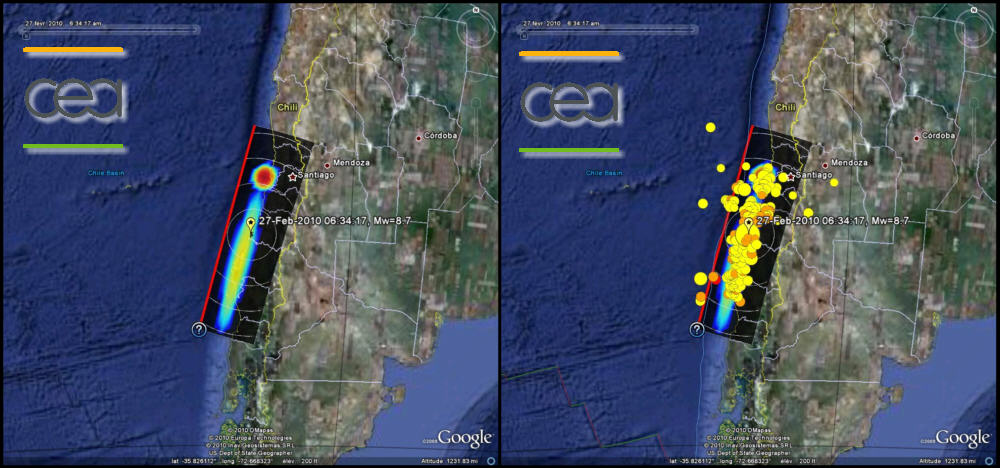
Figure 3: On the left, location of the slip zone (multicoloured ellipse). On the right, location of the aftershocks (source: CEA/DAM).
Tide-gauge observations and effects of the tsunami (preliminary results)
Because of its location at sea and very strong magnitude, this earthquake generated a major tsunami whose effects were observed throughout the Pacific. Figure 4 shows the travel times of the tsunami across the Pacific Ocean according to PTWC.
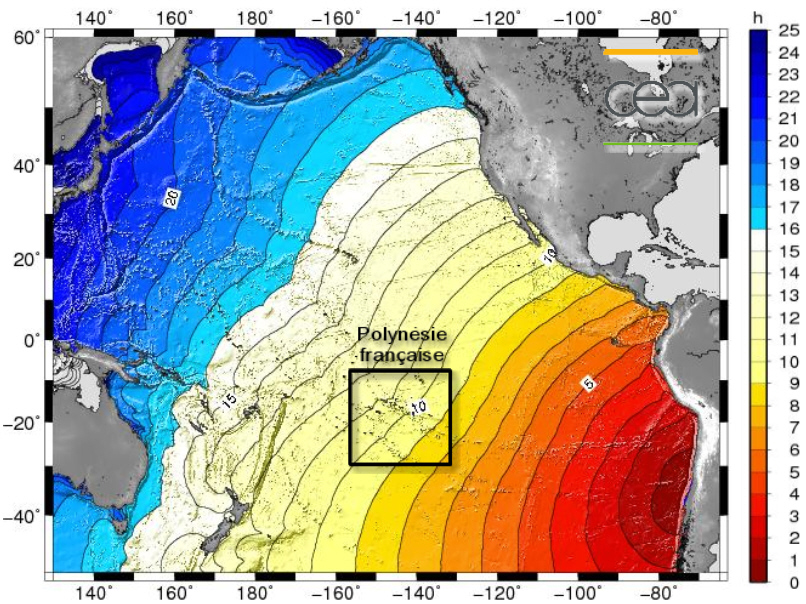
Figure 4: Theoretical travel times of the tsunami in hours after the onset of the earthquake (source: CEA/DAM).
Figure 5 shows the recorded tide gauges in the Marquesas Islands and Tahiti. Amplitudes up to 3 m are clearly observed.
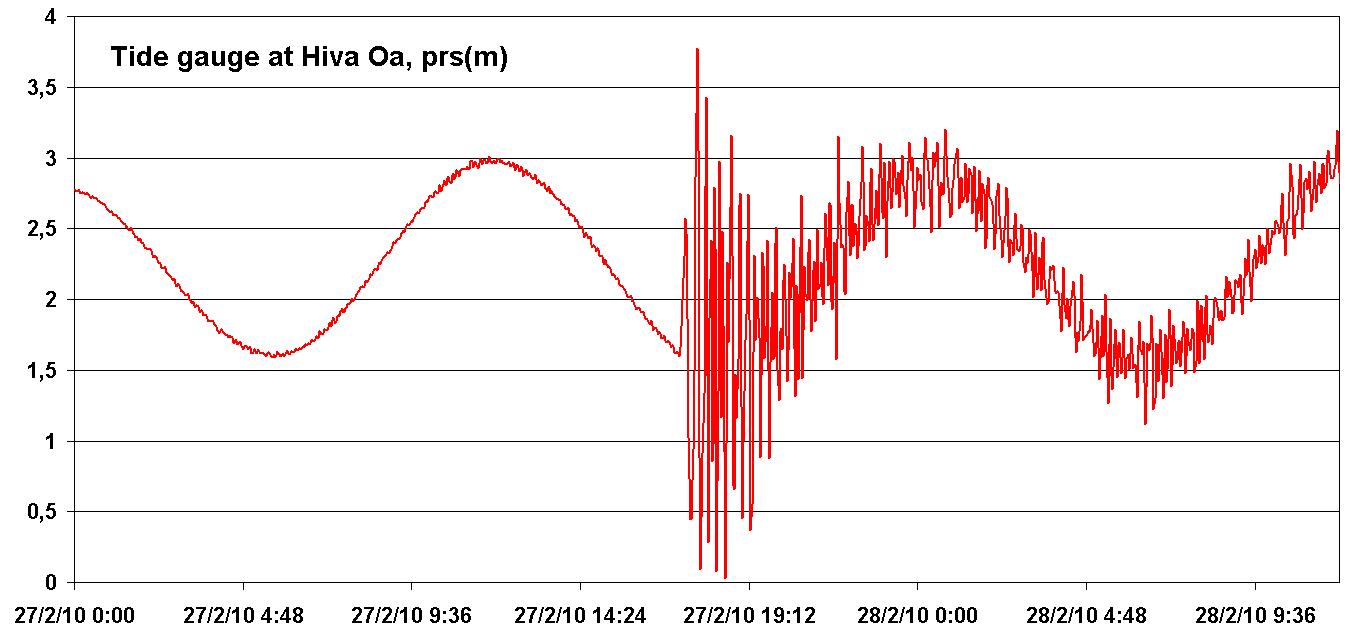 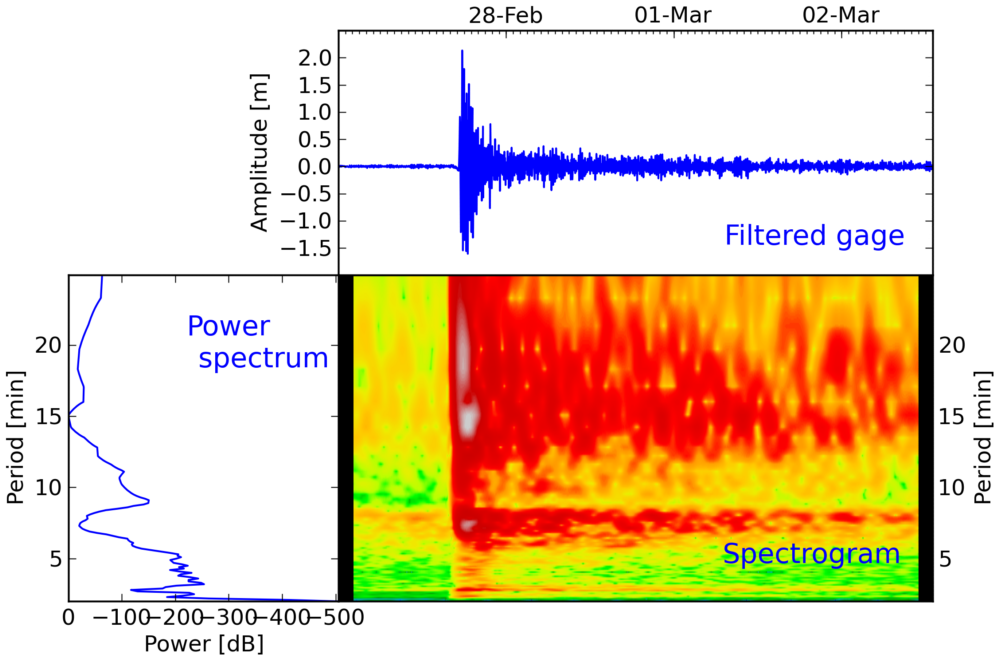
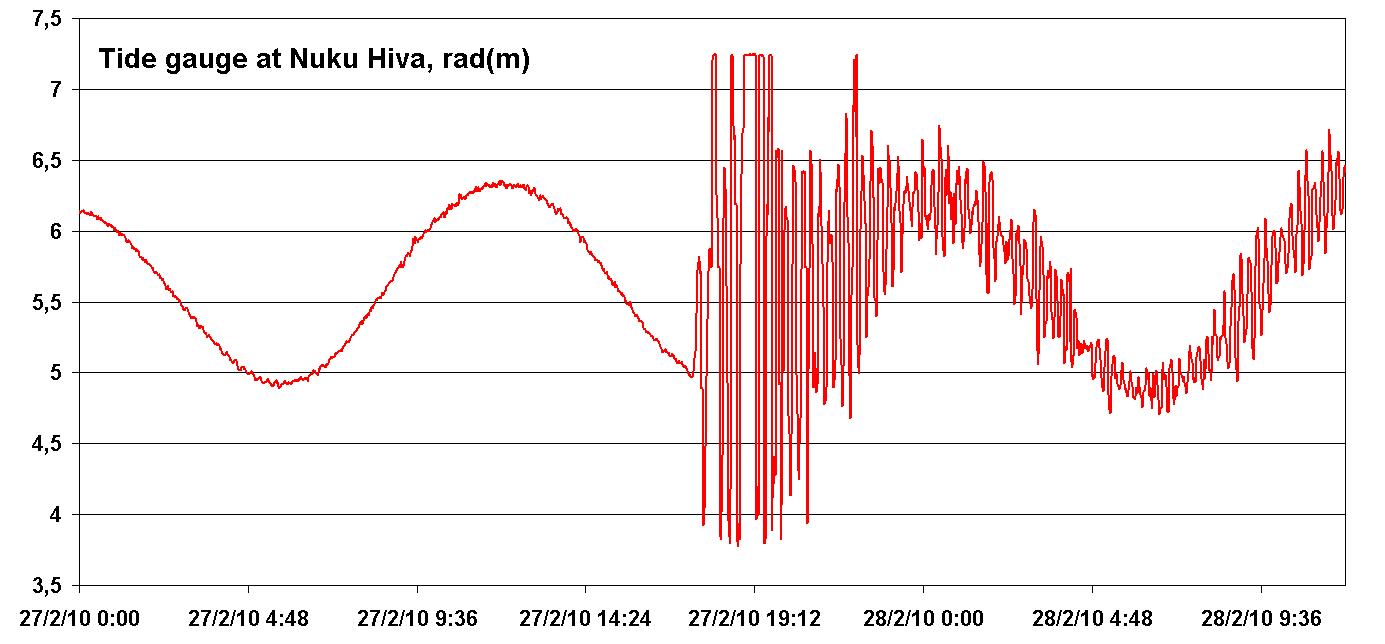 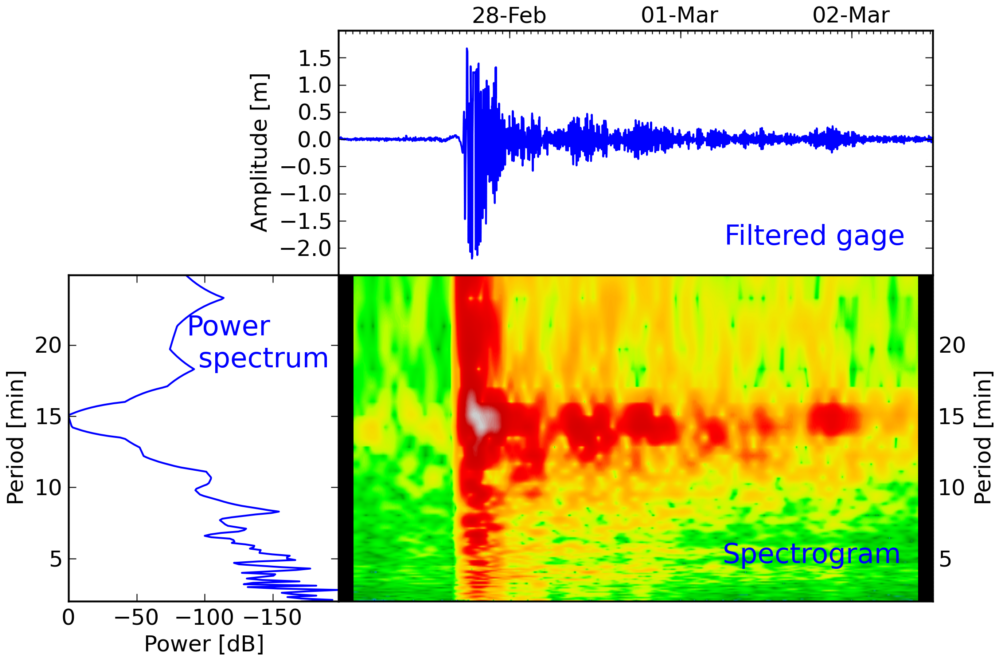
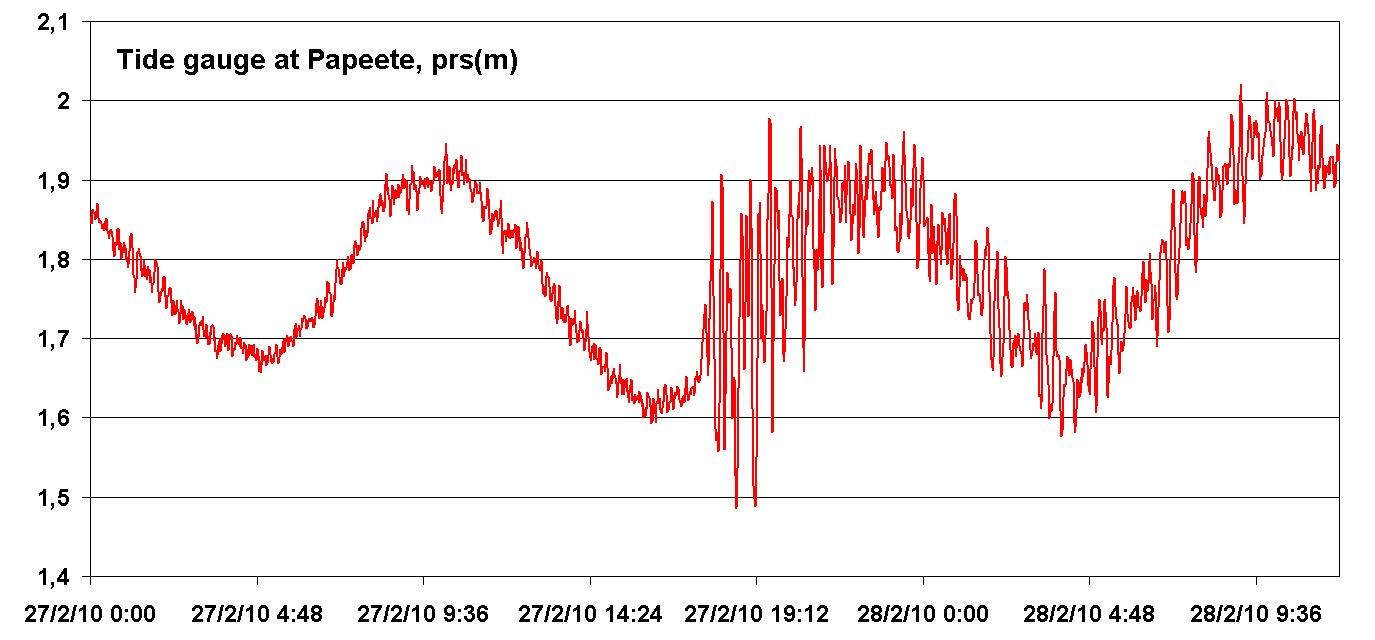 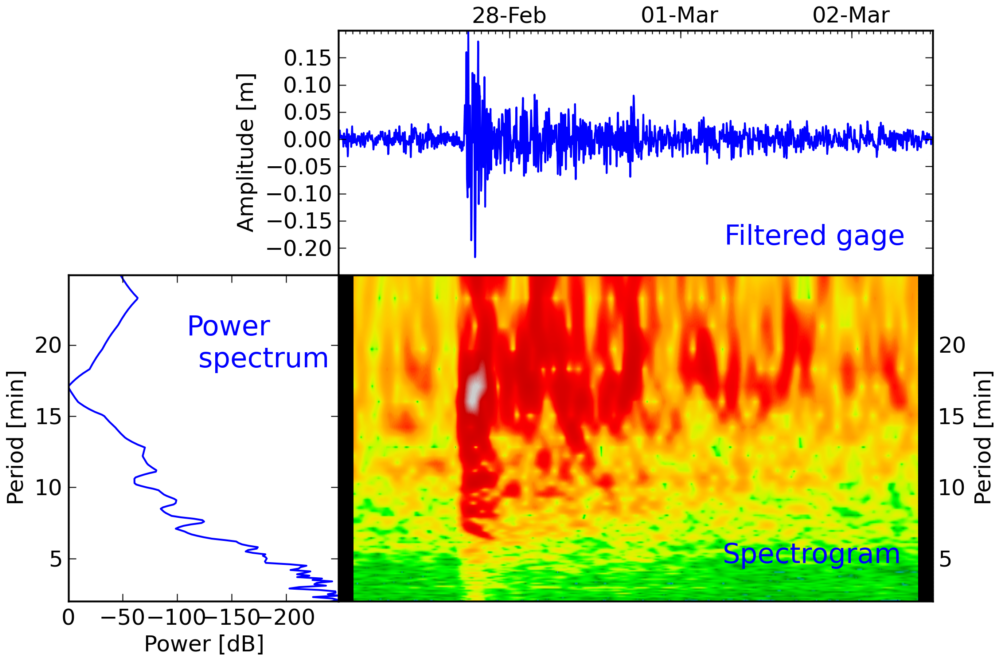
Figure 5:Tide gauge records in Hiva Oa (top), Nuku Hiva (center) and Papeete (bottom). Right: filtered data and spectrograms.
According to the Tahiti newspaper La Dépêche, a maximum wave height of 30 cm was observed on the island of Rikitea, with a first wave of 1 m at Hiva Oa followed by a series of larger waves of 4 m at Atuona and a 1.50-m wave on the island of Nuku Hiva. A wave height of more than 3 m was also reported on the island of Juan Fernandez off Chile.
In Japan, a wave with a maximum height of 1.50 m was also reported to have caused a large flood in the port of Shichigahama in the North of Japan.
For Polynesia, the treatment of the tsunami alert was carried out according to the following chronology, given in standard local time (source: Pamatai Geophysics Laboratory (PTWC of Tahiti) and the Tahiti La Dépêche of 28 February 2010):
- 20h34 –central Chile is struck by a violent earthquake of magnitude 8.8..
- 21h30 – the high commissioners office is informed jointly by the Pamatai Geophysics Laboratory and the seismic monitoring centre of Hawaii.
- 22h30 the high commissioners office activates the crisis unit, which collects and handles all the information enabling an evaluation of the height of waves likely to affect the Polynesian archipelagos.
- 23h30 01h00 the communes and their officers are informed of the risks of a tsunami so that, in turn, they set up crisis units in the town halls.
- 04h00 sirens are activated to inform the population of a risk of a tsunami on the whole of the territory.
- 05h00 is prohibited on the road network closer than 500 m from the seafront.
- 06h15 a first 11-cm wave followed by a 30-cm wave affects the island of Rikitea.
- 06h40 a retreat of the sea is noted at Rapa, followed by the opposite phenomenon.
- 07h19 08h20 a first 1-m wave affects Hiva Oa, followed by a series of larger waves of 4 m height at Atuona.
- 07h50 Une première vague de 1,50 m touche lîle de Nuku Hiva.
- 08h00 09h00 some waves of 40 cm are noted in the port of PAPEETE, as well as stones projected onto the coastal road at the level of Papenoo.
- 09h00 alert lifted in the Gambier Islands.
- 09h30 alert is lifted at Rapa.
- 10h15 alert is lifted on the whole of the territory except for the Marquesas Islands, which continue to be affected by waves of 2 m.
- 11h20 end of alert in the Marquesas.
Tsunami modélisation (preliminary results)
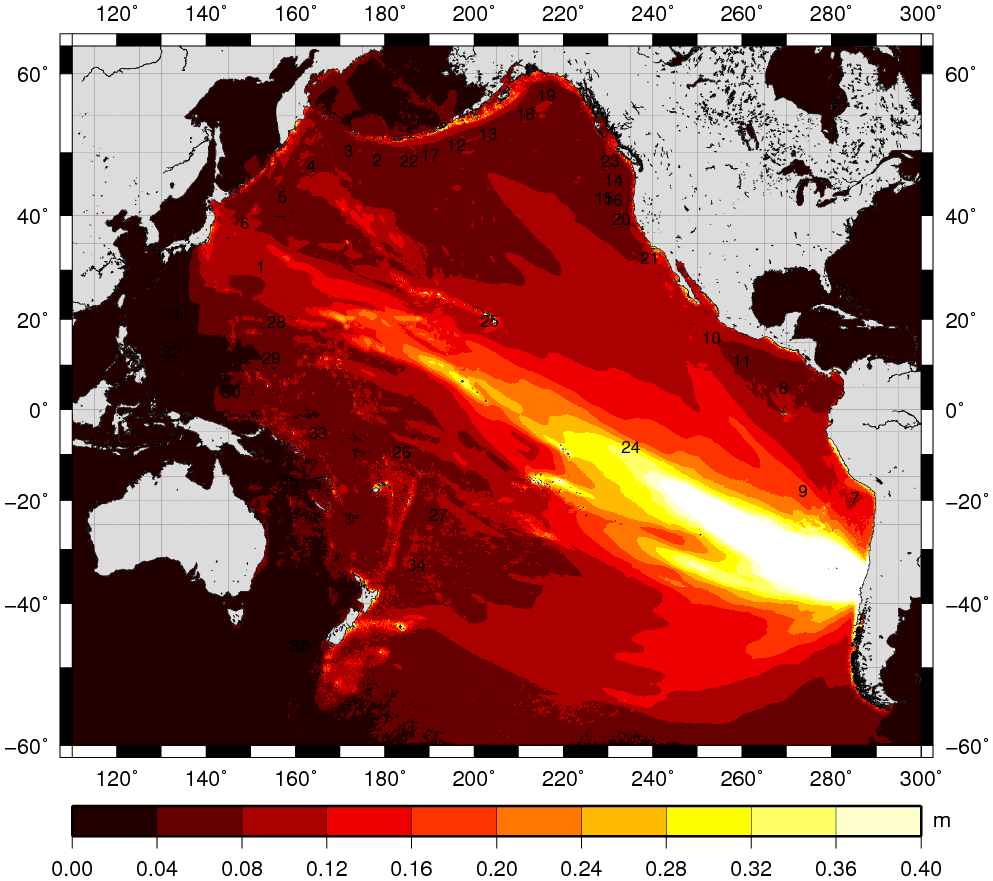
Figure 6: Maximum computed tsunami heights after 23 h of propagation across the Pacific.
The following maps represent the maximum elevation wave simulated using seismic parameters from the PDFM solution above. The associated tsunami has been modeled through a parallel finite-difference numerical model solving shallow water equations. Tsunami propagation has been computed over the Pacific ocean using multiple grids located over French Polynesia. The simulation used 64 processors on the massive parallel processing system : CCRT ; for example, we obtained the results after 86 minutes of computing for a tsunami propagation of 15 hours.
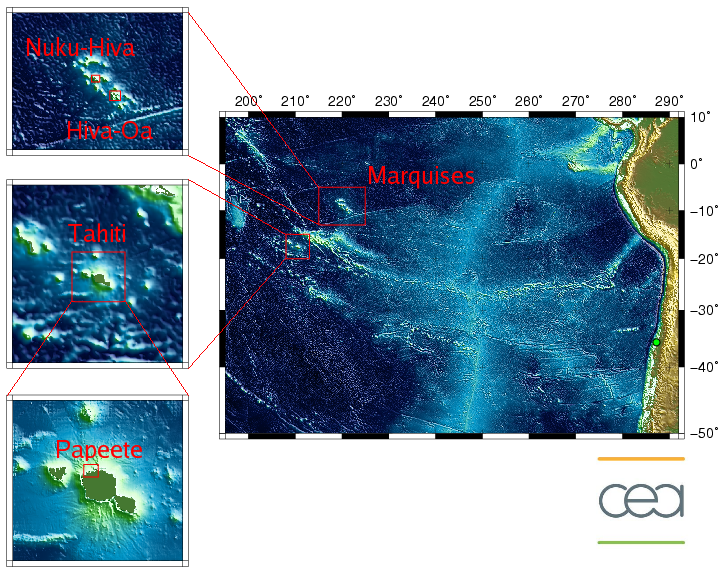
Figure 7: Geographical domain of the differents maps below.
Figure 8: Maximum computed tsunami heights after 12 h of propagation for the islands of Hiva Oa, Nuku Hiva and Tahiti. Right: focus on the bays of Atuona-Tahauku (Hiva Oa), Taiohae (Nuku Hiva) and Papeete 5tahiti).
|
)
)
)
)
)
)
)
)
)
)
)
)
)
)
)
)
)
)