 |
 |
 |
|
 |
|
|
|
scientific files |
|
|
| |

|
Monitoring eruption of the Icelandic volcano Eyjafjöll by infrasound measuring stations
|
 Article: Article:
The Icelandic volcano Eyjafjöll (Lat. 63.6° N, Long. 19.62° W), located under the Eyjafjallajökul glacier, started to show signs of activity at the beginning of March 2010. The eruptive activity began on 14 April 2010 at 1h15 UT, causing the melting of the glacier with major floods and mud flows, making it necessary to evacuate 800 people. A plume of ash ejected into the upper atmosphere paralyzed the air traffic in northern Europe for a week. The activity of this volcano was detected by Infrasound stations located thousands of kilometres away from the source.
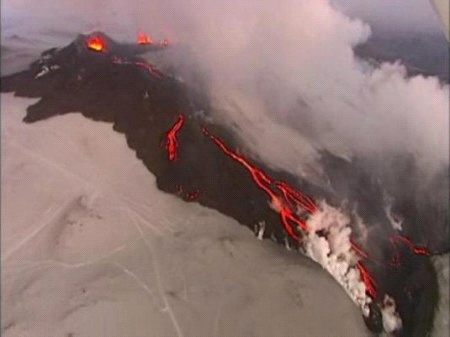
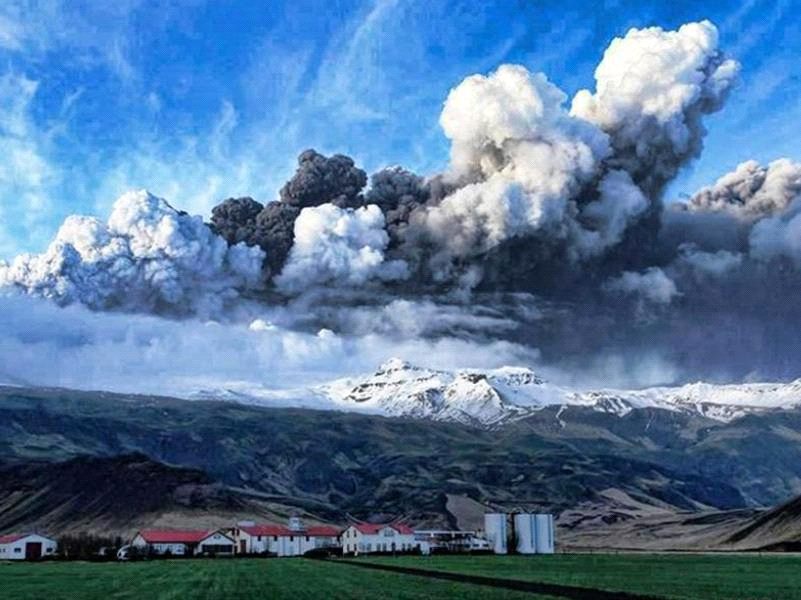
 Photograph on left: Raymond Matabosch Photograph on right: REUTERS agency Photograph on left: Raymond Matabosch Photograph on right: REUTERS agency
Many eruptive phases were recorded by a network of infrasound stations located more than 1 800 km far from the volcano: this network is part of the CTBT monitoring system, with stations located in Greenland (I18DK), Alaska (I53US), Russia (I43RU and I46RU), Kazakhstan (I31KZ), Germany (I26DE) and Tunisia I48TN. In addition, the network includes the experimental stations of Flers (Normandy), ADBF (Ile-de-France), IGADE (Germany) and the Swedish and Finnish stations of JAMTON, KIRUNA, LYCKSELE and SODANKYLA. Figure 1 shows the locations of these stations with respect to the volcano.
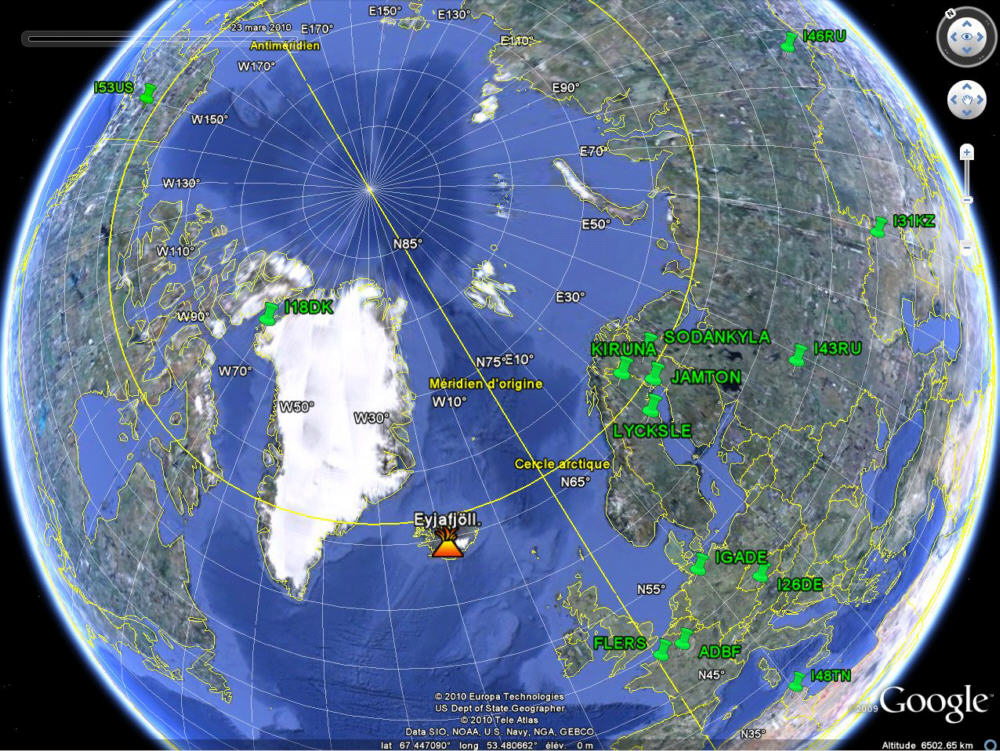
Figures 1: Location of the infrasound stations (green pins) that detected the eruptions of the Eyjafjöll volcano.
Figure 2 shows an example of a time/frequency diagram calculated from weekly automatic bulletins (PMCC method), based on a continuous recording at Flers in Normandy: each black band corresponds to a single day, with the X-coordinate representing the time from 0 to 24h UTC, and the Y-coordinate the frequency from 0 to 4 Hz. The coloured rectangles represent automatic detections, whose azimuth (0-360°, direction of arrival of the wave at the station with respect to north) is indicated on the scale on the right-hand side of the figure.
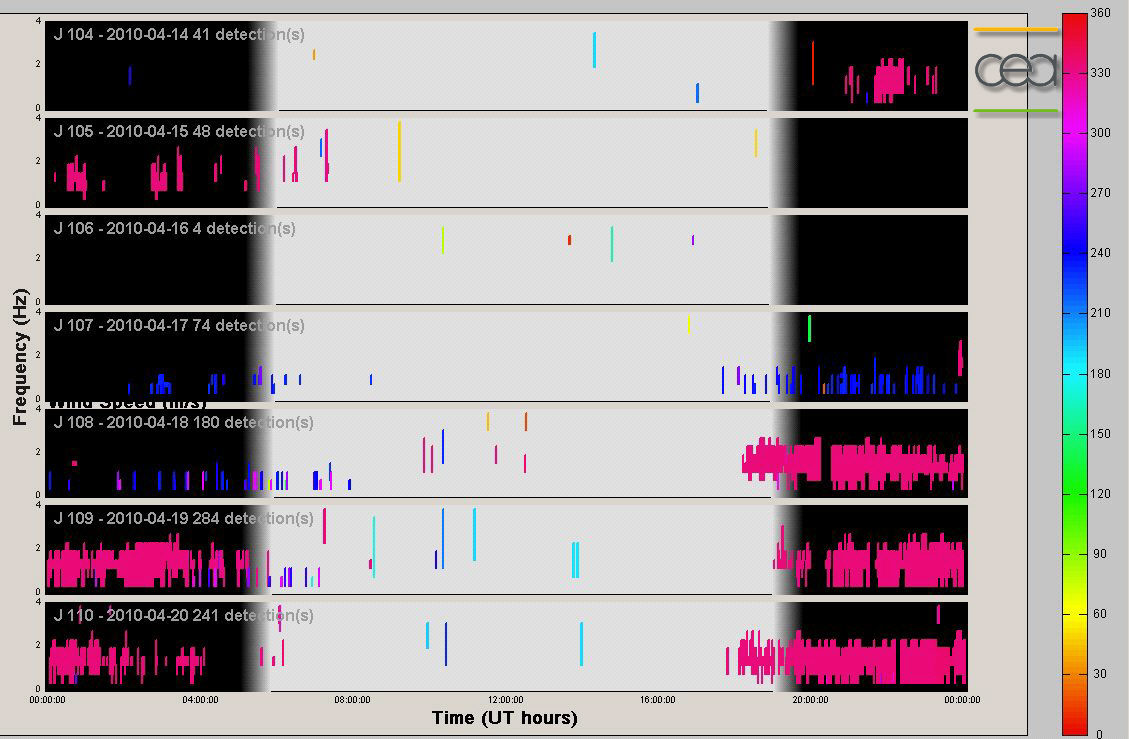
Figures 2: Screen capture of 7 days of automatic PMCC detections of the infrasound station at Flers in Normandy from 14 to 20 April 2010.
Detected signals in red correspond to the recordings of infrasound waves generated by the volcano, which are located in the range of intermediate frequency (0.5 to 2.5 Hz). We note the absence of any infrasound events during the day, due exclusively to the local wind or human activities, which would increase the background noise level of the station, and thus decrease its detection capability.
Figure 3 shows an alignment of automatic PMCC bulletins from stations which detect the activity of the volcano, ordered by increasing azimuth from 0 to 360°, indicating the distance and the theoretical travel time of sound waves from the volcano to the station (assuming a stratospheric propagation at 300 m/s). Infrasound events are aligned with respect to the source (they are offset by the appropriate travel time) to facilitate the identification of the stations which detect the same explosions.
The first eruptions of the volcano on 14 and 15 April are clearly detected by stations I46RU, I43RU and I18DK as well as Swedish and Finnish stations located North-East of the volcano. From April 18, we note an appreciable increase in the number of events detected by all the stations: figure 4 shows the seismic activity measured at Godabunga (on the summit of the glacier) approximately 20 km away from the eruptive centre, thus confirming a renewal of volcanic activity.
However, there is no straight forward correlation between seismic and acoustic activity. The seismic activity is an expression of the rise of magma, so there is no associated acoustic source while there is no explosion (for the first explosion, we can see that the acoustic signal arrives well after the peak of seismic activity).
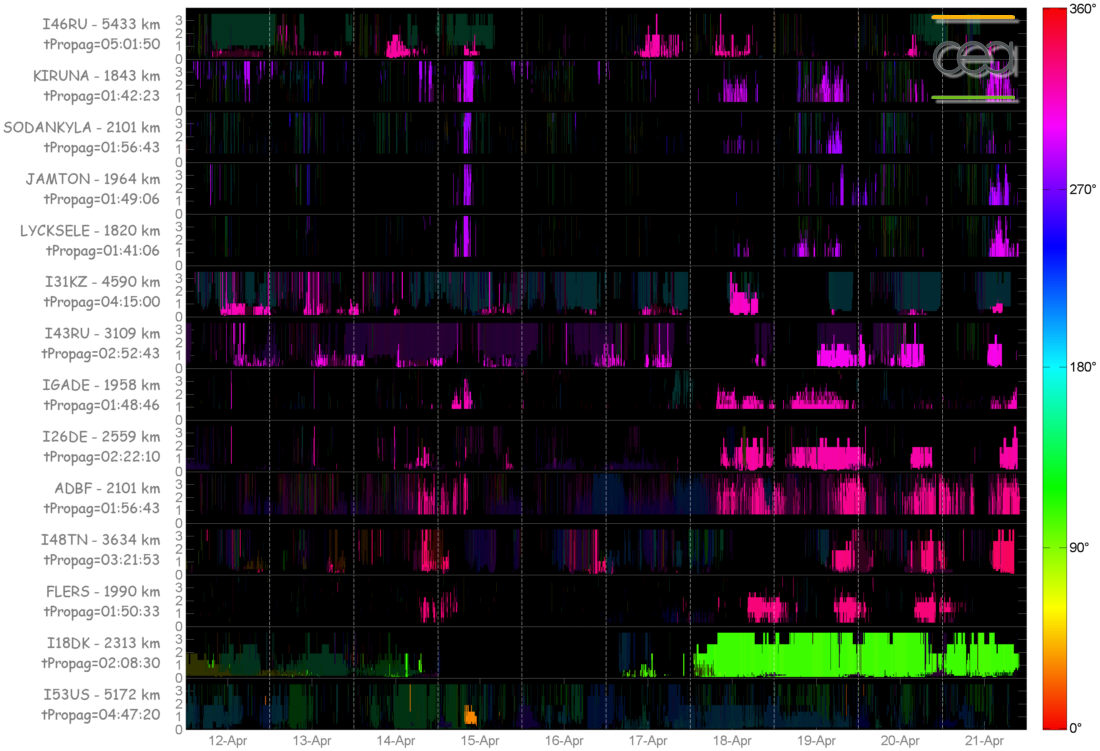
Figures 3: Alignment of automatic PMCC bulletins from 14 infrasound stations located less than 5 500 km from the volcano.
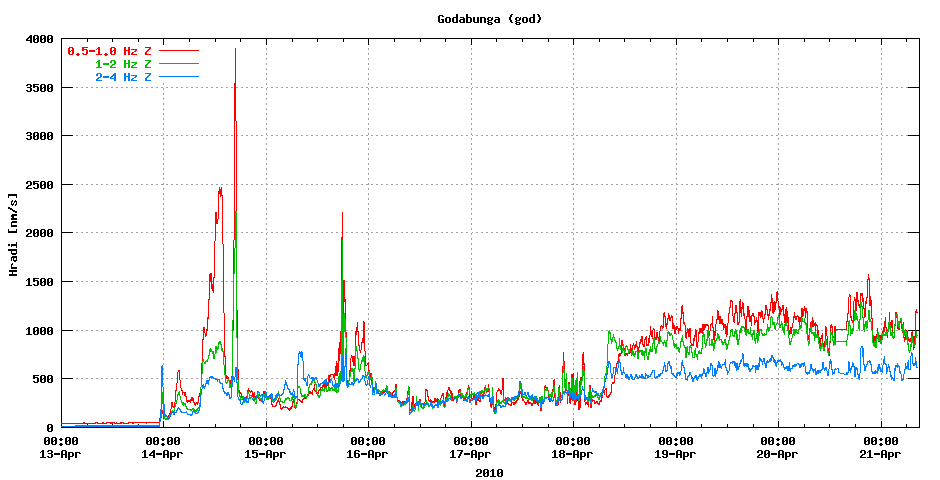
Figures 4: Graph showing seismicity recorded on the summit of the glacier from 13 to 20 April 2010.
| |
|
|
|
)
)
)
)
)