| |


|
Third information update concerning the Japan earthquake of 11 March 2011 at 5h46 UT.
(update 23 March 2011, 17h - French time)
|
A major earthquake of magnitude MW 8.9 occurred in the north of Japan on 11 March 2011 at 5h46 (UT) near the cities of Sendaï (130 km) and Tokyo (370 km). This earthquake generated a major tsunami that crossed the Pacific Ocean, with notable effects in Chile, where waves of 1 to 2 m were recorded.
 Description of the earthquake Description of the earthquake
Geographical situation:
| Magnitude: |
Mw 8.9 |
| Area: |
Off the East coast of Honshu, Japan |
| Onset time: |
11-03-2011 05:46:23 UT |
| Location: |
38.30 N ; 142.50 E |
| Depth: |
22 km |
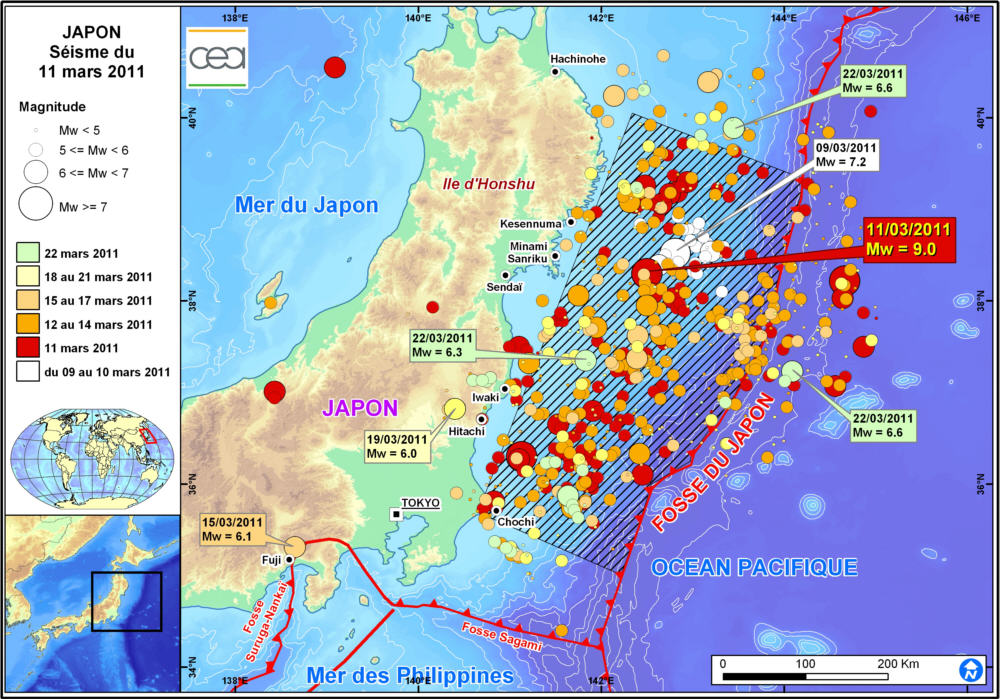
 Figure1: The seismo-tectonic context of the Mw=9 earthquake of 11March 2011. In addition to locating the main shock of the crisis, the map shows the foreshocks (from 2 to 10 March 2011) and aftershocks (up to 22 March 2011 included). The hatched field represents the zone of supposed rupture, estimated from the results of source inversion and the distribution of aftershocks. Figure1: The seismo-tectonic context of the Mw=9 earthquake of 11March 2011. In addition to locating the main shock of the crisis, the map shows the foreshocks (from 2 to 10 March 2011) and aftershocks (up to 22 March 2011 included). The hatched field represents the zone of supposed rupture, estimated from the results of source inversion and the distribution of aftershocks.
Seismo-tectonic context
At the level of the Japan trench, the Pacific plate is being subducted under the Eurasia plate in the Northern part of the island of Honshu at a rate of almost 9 cm/year. Because of this fast convergence rate, a very large number of strong-magnitude earthquakes have occurred in this region of Japan. Several of these events have generated major tsunamis. Such was the case, in particular, for the strong tsunamigenic earthquakes of 869, or 1896 and 1933, which ruptured large segments of the subduction plane, respectively, either at the latitude or North of the area impacted by the earthquake and tsunami of 11 March last. In addition to these events, 15 strong earthquakes of magnitude greater than 7.5 have taken place in this region since the beginning of the 20th century (cf. Fig. 2).
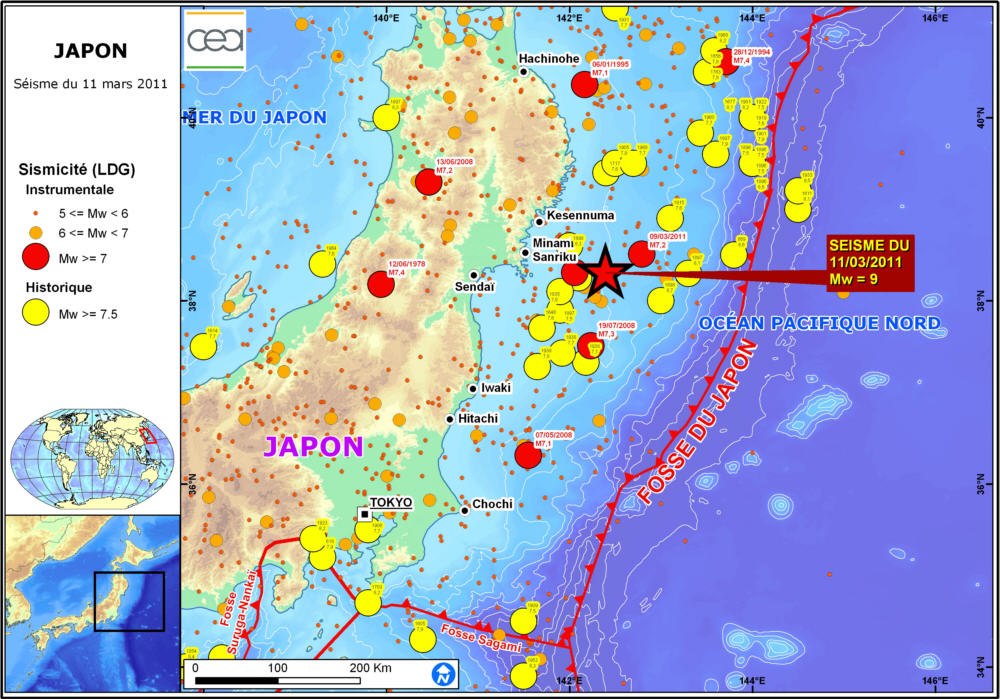
Figure 2: Map showing historical seismicity of the North-East of Japan.
This area lies to the North of a more complex zone of convergence eventually involving three tectonic plates (see triple point, Fig. 3), whose boundaries are illustrated on Fig. 1. This zone, located to the South of the island of Honshu, has itself also been at the origin of very many strong seismic events, including the Kanto earthquake in 1923, which destroyed the Tokyo area (Fig. 2).
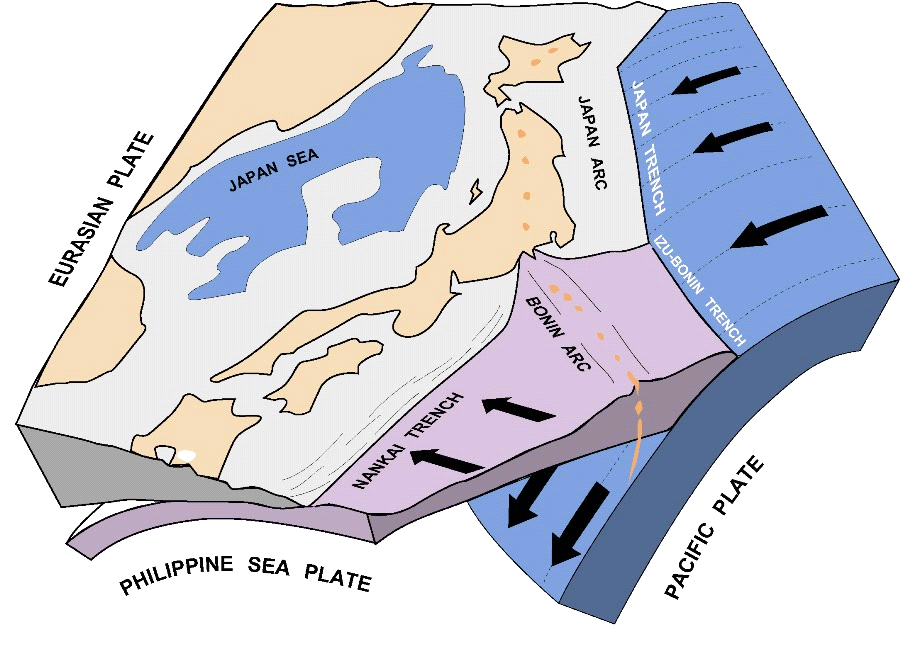
Figure 3: General sketch showing the geometry of the tectonic plates and their respective movements in the Japan region (according to L. Jolivet, ISTO, Orleans, France).
Seismic crisis
A number of strong-magnitude seismic events were recorded in the 48 hours preceding the main shock. The first of these events, of magnitude MW 7.2, took place on 9 March, and was located approximately 40 km from the epicentre of the earthquake of 11 March; it was followed, on the same day, by three other earthquakes of magnitude greater than MW 6.
As of 23 March 2011 at 0h UT, a total of 401 aftershocks of magnitude 5 or greater (source EMSC) had been recorded, including 40 of magnitude 6 or greater and 2 of magnitude 7 or greater, which occurred 40 minutes after the main shock.
Figure 4 shows the progressive reduction in the number of aftershocks with time; however, we should note that, among the events of March 22, there are 3 earthquakes of magnitude greater than 6.
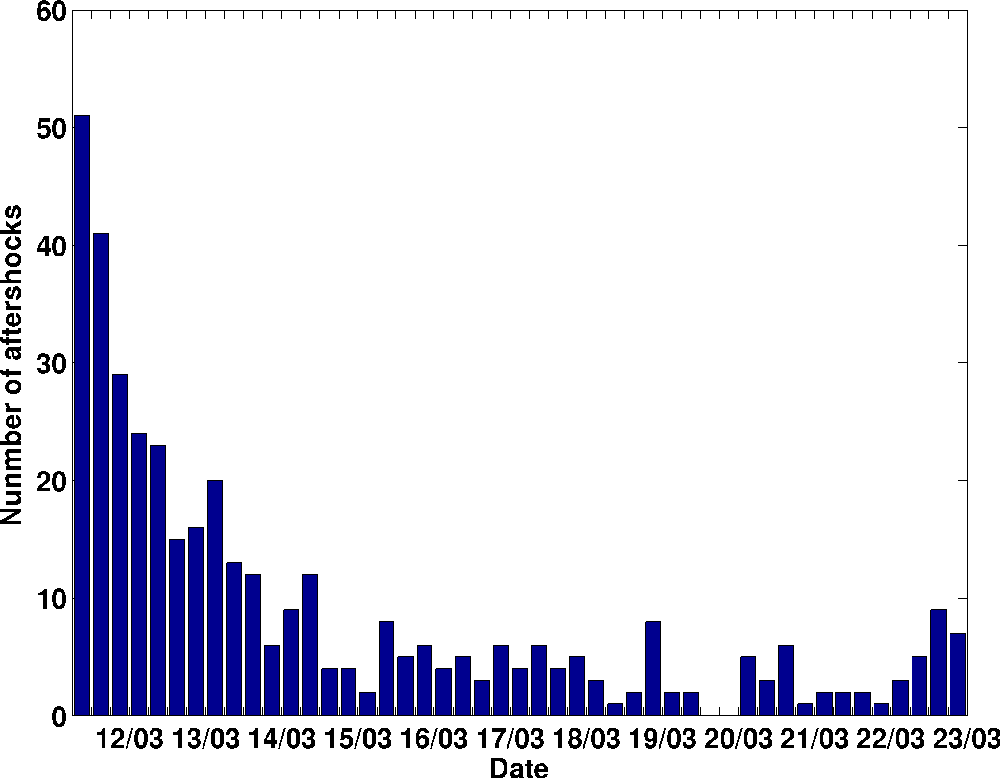
Figure 4: Histogram showing the number of aftershocks of magnitude greater than or equal to 5, occurring in 6-hour time slices following the 11 March earthquake (source: EMSC).
Mechanism of the rupture
By inversion of the seismic moment tensors, it is possible to determine the orientation of the fault plane that has undergone rupture. The map shown on Fig. 5 presents the results obtained by several organizations, indicating a fault rupture plane striking NNE with a gentle dip towards the WNW.
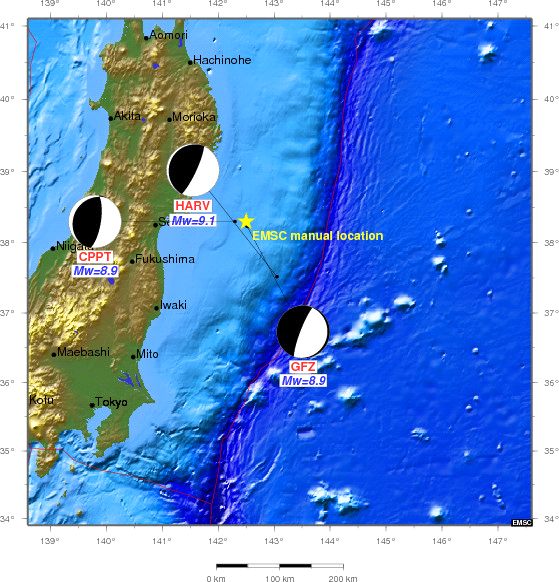
Figure 5: Focal mechanisms for the 11 March earthquake obtained by various organizations. CPPT: Pacific Tsunami Warning Centre (PTWC) CEA/LDG-Pamatai; HARV: University of Harvard;
GFZ: Deutsches GeoForschungsZentrum, Potsdam, Germany (source: EMSC).
Kinematic inversion allows us to describe the rupture in finer detail, by reconstructing the seismograms based on a spatial and temporal definition of the rupture.
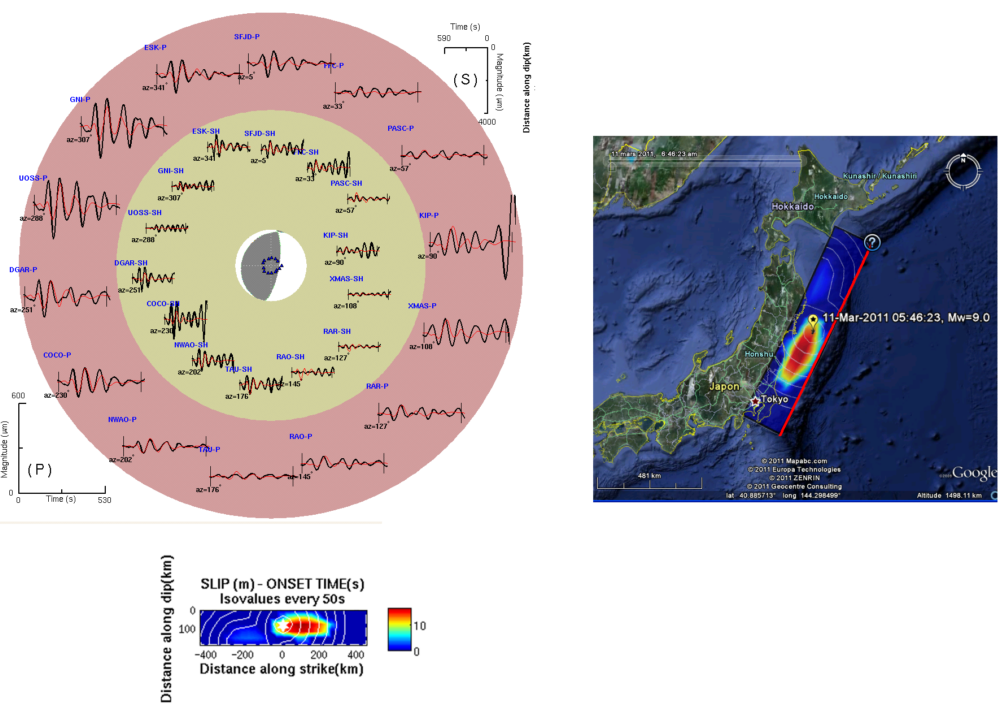
Figure 6: Inversion of the earthquake of ?11 March 2011. The results lead to a source of Mw9 with two zones of rupture, with the main zone, in the South, having a maximum slip of at least 15 m (source CEA/DAM).
This estimation involves reproducing seismic recordings at great distances from the epicentre by reconstructing the rupture history using the method of patches (Vallée and Bouchon: Imaging co-seismic rupture in far-field by slip patches, JGI, 2004). For this purpose, we reconstruct the displacements of the compressional (P) and shear (HS) body waves to achieve a better forcing of the seismic source.
Kinematic inversion using the long-period data from seismic sensors (CEA and IRIS) leads to a focal mechanism involving a reverse fault, a magnitude of Mw=9 and an epicentral depth of 25 km. The rupture consists of two zones, which taken together extend over approximately 400 km. The maximum slip of at least 15 m took place on the zone located in the South. Similar results are obtained by other organizations (cf. Fig. 7).
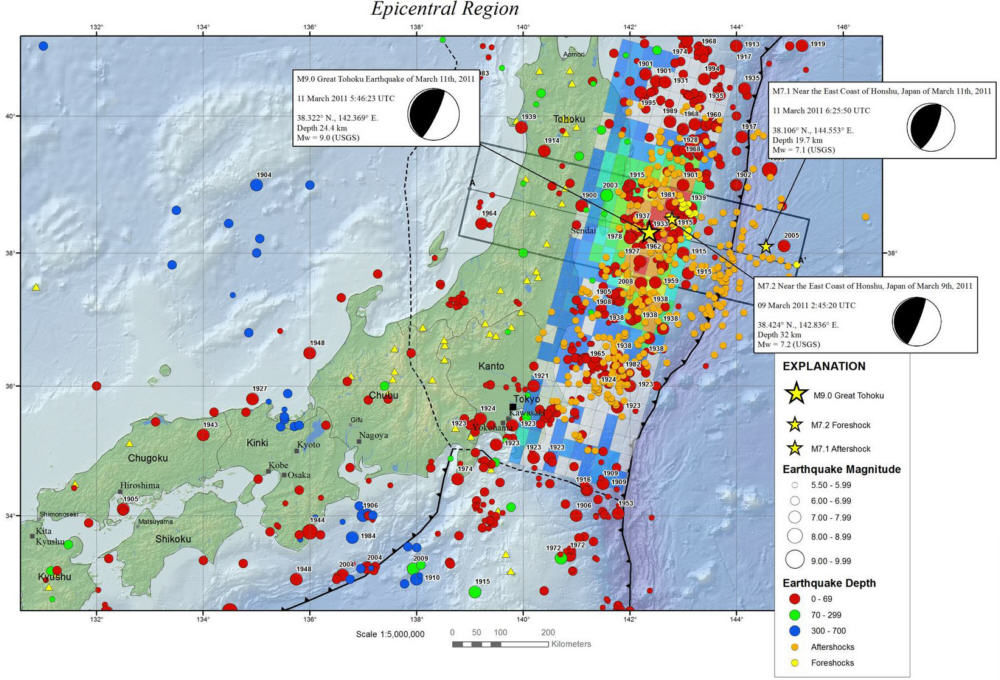
Figure 7: Map showing recorded seismicity (coloured circles and stars), and rupture zone of the main shock, with values of slip (small rectangles coloured according to magnitude scale on right of map). (source USGS: http://earthquake.usgs.gov/earthquakes/eqarchives/poster/2011/20110311.php).
Measurements of the peak of acceleration
Japan has a very dense network of accelerometers. The map below uses coloured symbols to show the maximum values measured by the sensors in the area close to the earthquake. We note that several of these instruments (in black) measured extremely high values, exceeding 1 g.
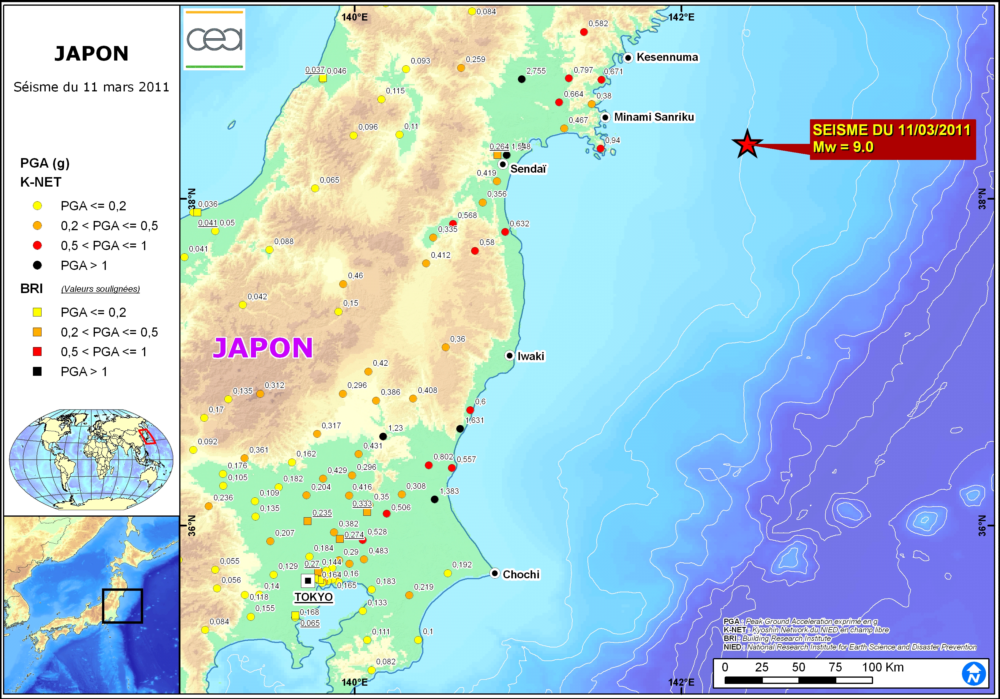
Figure 8 : Map showing peaks of acceleration measured on the network of accelerometers in Japan. (Sources : Building Research Institute and Kyoshin Network du NIED)
Information on the tsunami
The earthquake generated a major tsunami, whose effects were observed in Japan and throughout the Pacific. The JMA (Japan Meteorological Agency) recorded wave heights of more than 3 m at tide-gauge stations in the North-East of Japan. In particular, the station of Soma, to the South of Sendaï, recorded a wave of at least 7.3 m, which represents the maximum amplitude measured to date by a tide gauge. Several stations did not yield any measurements because of the destruction of the tide-gauge. Taking into account the local configurations of the coasts, higher amplitudes could occur locally.
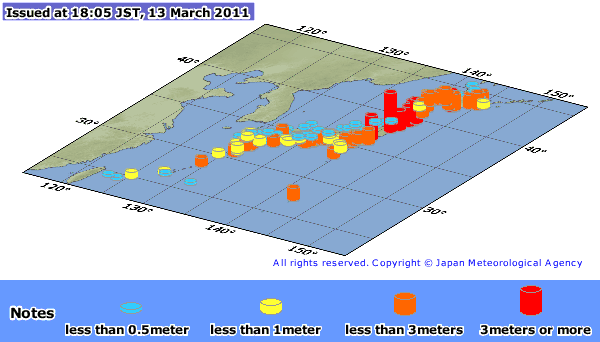
Figure 9: Map showing heights of the tsunami measured by tide-gauge stations in Japan (source JMA).
The tsunami was observed at many points in the Pacific Ocean, as far as the coasts of Peru and Chile, more than 21 hours after the earthquake (cf. Fig. 10). In particular, information from the Pacific Tsunami Warning Centre (PTWC) gave a report of waves of 2.0 m at Crescent City (California), 1.45 m at Manzanillo (Mexico), 1,7 m at Callao (Peru), or 1,25 m at Corral in southern Chile (cf. Figs. 11 and 12). According to the PTWC, large waves were measured in Hawaii (1.20 m at Kawaihae, 1.40 m at Hilo). In the South-west Pacific Ocean, the measured amplitudes were lower (20 cm in Papua New Guinea). Wave heights of 0.4 m were also observed at the tide-gauge station of King Edward (Sandwich Islands), in the South Atlantic, more than 24 hours after the earthquake.
French Polynesia was also affected by this tsunami, 12H30 after the earthquake (in Tahiti). Wave heights of about 40 cm were measured at Papeete, on the island of Tahiti, and 30 cm on the atoll of Rangiroa.
Higher values of up to 1.5 m were measured at Nuku Hiva and Hiva Oa, in the Marquesas Islands, because of a local amplification effect.
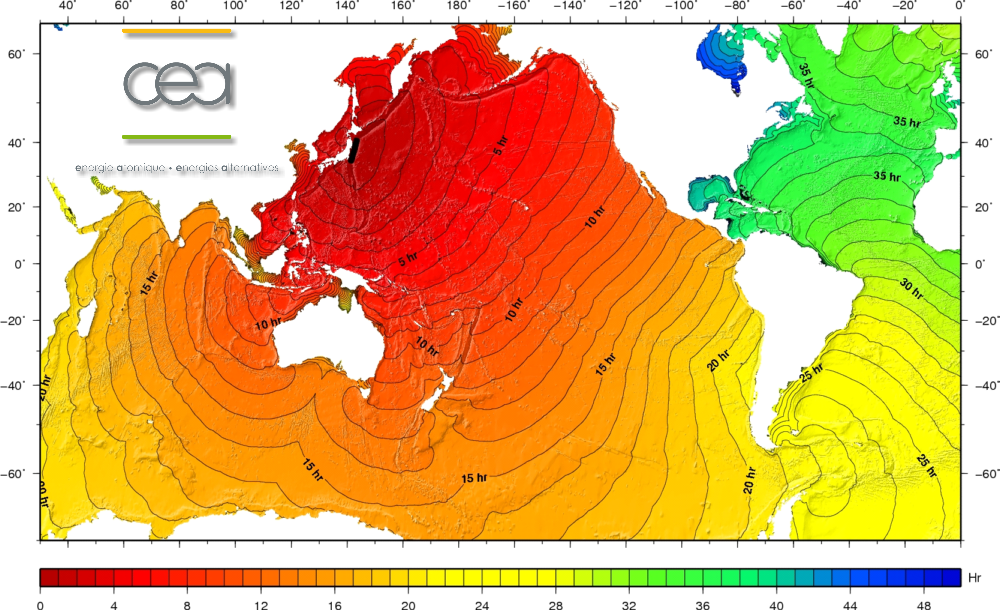
Figure 10: Map showing travel times of the tsunami through the ocean, considering the fault model as a line of point sources (source: CEA/DAM, simulation carried out with TTT software (GeoWare)).
Site of tide-gauge |
Wave height
0-peak (according to PTWC) |
Kawaihae, Hawaii |
1,22 m |
Adak, Alaska |
1,00 m |
Crescent City, California |
2,02 m |
Manzanillo, Mexico |
1,45 m |
Callao, Peru |
1,67 m |
Corral, Chile |
1,25 m |
King Edward, Sandwich Islands |
0,40 m |
Papeete, Tahiti, French Polynesia |
0,39 m |
Hiva Oa, Marquesas, French Polynesia |
1,50 m |
Nuku Hiva, Marquesas, French Polynesia |
1,48 m |
Rikitea, Mangareva, French Polynesia |
0,21 m |
Rangiroa, Tuamatu, French Polynesia |
0,29 m |
Figure 11: Wave heights measured at various points in the Pacific Ocean (according to PTWC)
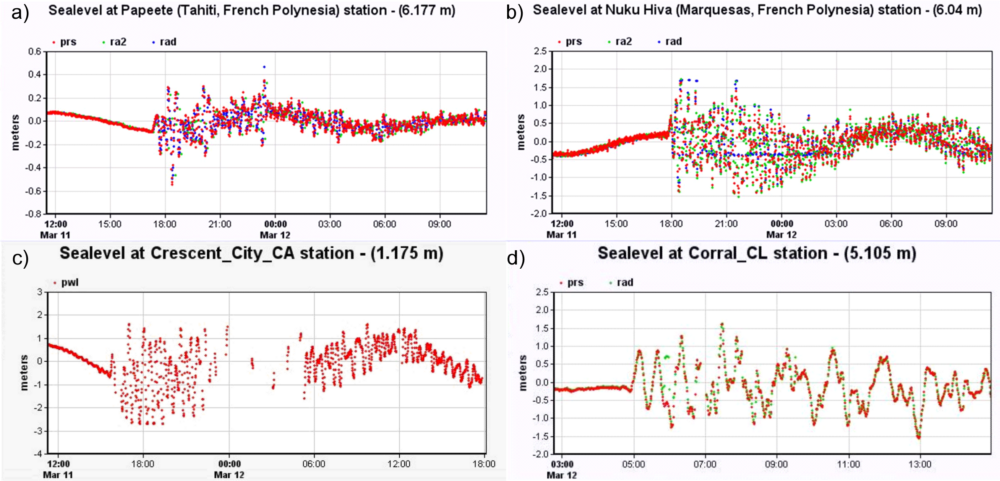
Figure 12: Variations of sea level recorded on tide gauges during the passage of the tsunami. (Source IOC-VLIZ). a) Papeete (Tahiti, French Polynesia), b) Nuku Hiva (Marquesas Islands, French Polynesia), c) Crescent City (California), D) Corral (Chile). In red: measurements by pressure transducer; in green and blue: measurements by radar.
The map given below (Fig. 13) represents the wave heights, calculated for deep water conditions. The wave height can be strongly amplified when the tsunami reaches the coast, according to the local bathymetry.
The wave heights attain 4-5 m in the epicentral zone, and maintain an amplitude of about 30 cm as far as the islands off the Chilean coast, which are located in the principal axis of propagation of the tsunami. Indeed, this map shows that the energy of the tsunami is mainly radiated in a south-easterly direction (towards Chile).
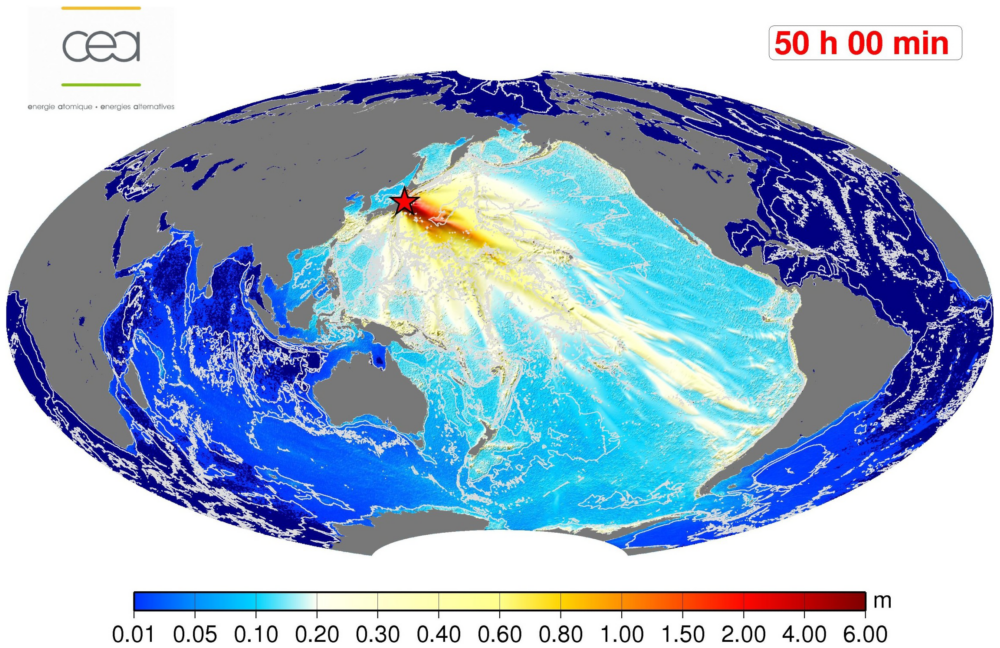
Figure 13: Map of maximum wave heights calculated offshore, after 50 H of propagation.
The animation presented below shows the evolution of instantaneous height with time over a duration of 50 hours. It shows the complexity of the successive waves propagating in the ocean, and even the presence of a wave train reflected off the coast of South America, which then returned towards the North-West across the Pacific Ocean. This wave train reached French Polynesia after approximately 32 hours of total propagation, that is to say, about 24 hours after the first wave. It was recorded by the tide-gauges, as shown in Figure 14.
Figure 14: Animation simulating propagation of the tsunami in the Pacific Ocean.
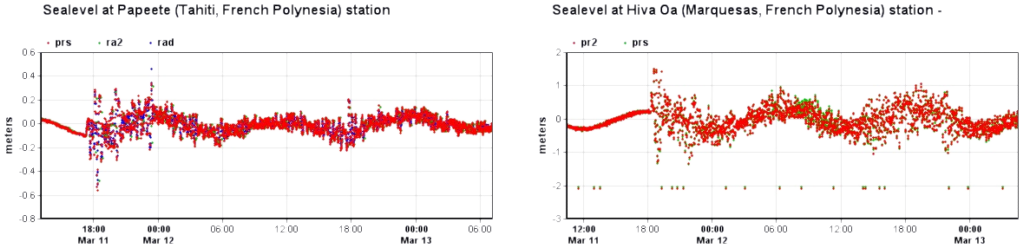
Figure 5: Variations of sea level recorded on tide-gauges during the passage of the tsunami (Source IOC-VLIZ) over a duration of more than 24 hours. On the left: Papeete (Tahiti, French Polynesia), on the right: Hiva Oa (Marquesas Islands, French Polynesia), In red: measurements by pressure transducer; in green and blue: measurements by radar. We can clearly see a second wave train, 24 hours after the first series of waves, which was reflected off the West coast of South America.
|
)
)
)
)
)
)
)
)
)
)
)