 
|
Earthquake of magnitude 8.7 off the west coast of Sumatra |
An earthquake of magnitude Mw 8.7 took place on Wednesday 11 April 2012 at 8h38 Universal Time (14h38 local time, 10h38 Paris time). Two hours after this large-amplitude earthquake, an aftershock of magnitude Mw 8.2 was also recorded. In the five hours following the main shock, 21 aftershocks of magnitude greater than 5.0 were detected and located (Figure 2).
Magnitude |
Mw 8.7 |
Area |
At sea, off the west coast of Sumatra |
Date |
11 April 2012 |
Hour |
08:38:35.0 UTC (14h38 local time) |
Location |
2.34 North (latitude); 93.16 East (longitude) |
Depth |
10 km |
Closest cities |
Banda Aceh at 430 km (Northern Sumatra, Indonesia)
Meulaboh to 385 km (Northern Sumatra, Indonesia) |
Figure 1 below shows the historical seismicity of the area as well as the two major events of 11 April 2012.
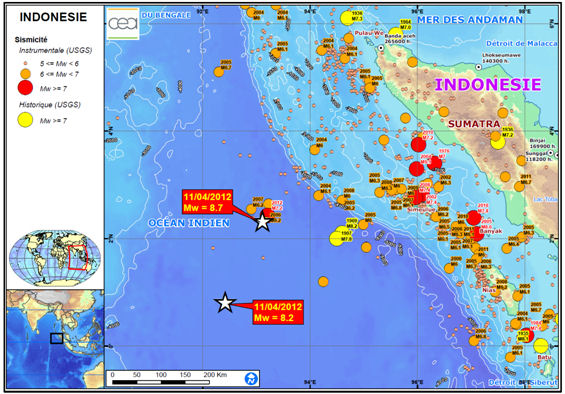
 Figure 1: Map showing historical seismicity of the north-eastern Indian Ocean and North Sumatra. Figure 1: Map showing historical seismicity of the north-eastern Indian Ocean and North Sumatra.
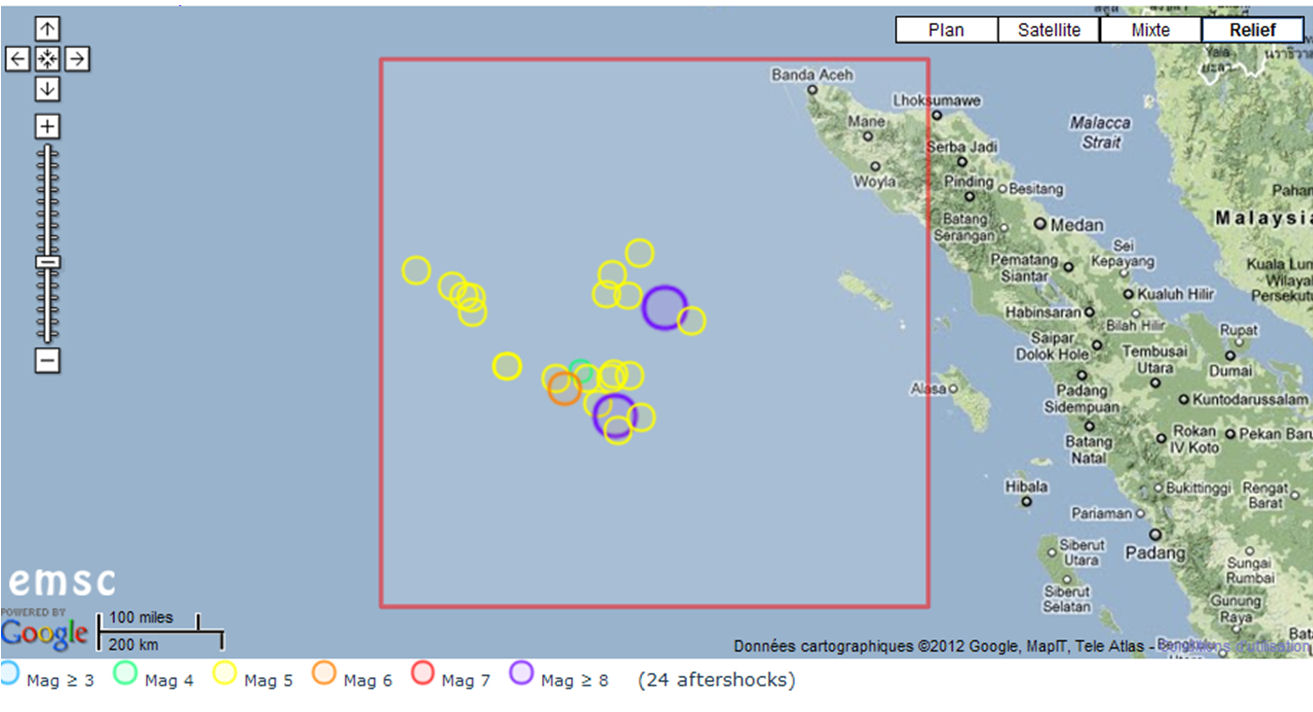
Figure2 : Preliminary map of the aftershocks on 11 April 2012 up to 15h00 UTC (information available in real time from the European-Mediterranean Seismological Centre http://www.emsc-csem.org/Earthquake/208/Mw-8-7-OFF-W-COAST-OF-NORTHERN-SUMATRA-on-April-11th-2012-at-08-38-UTC ).
In the hour following the earthquake, the CEA (Environmental Assessment and Monitoring Department) was able to provide a rupture mechanism indicating that this event had a low tsunamigenic potential: it involved a horizontal strike-slip motion giving rise to only limited displacement of the water masses. A low-amplitude tsunami was actually generated. In the zones affected by the tsunami, the measured rise in sea level was a few tens of cm and attained up to 1 m locally on the coasts of Indonesia. Figure 3 shows a simulation of the propagation of the tsunami.
Figure 3: Animation of the propagation of the tsunami in the Indian Ocean (source CEA/DAM).
The following figures show the estimated travel times of the generated tsunami with reference to the time of the main shock (Figure 4) as well as the tide-gauge recording at Coco Island located between Australia and Indonesia (Figure 5).
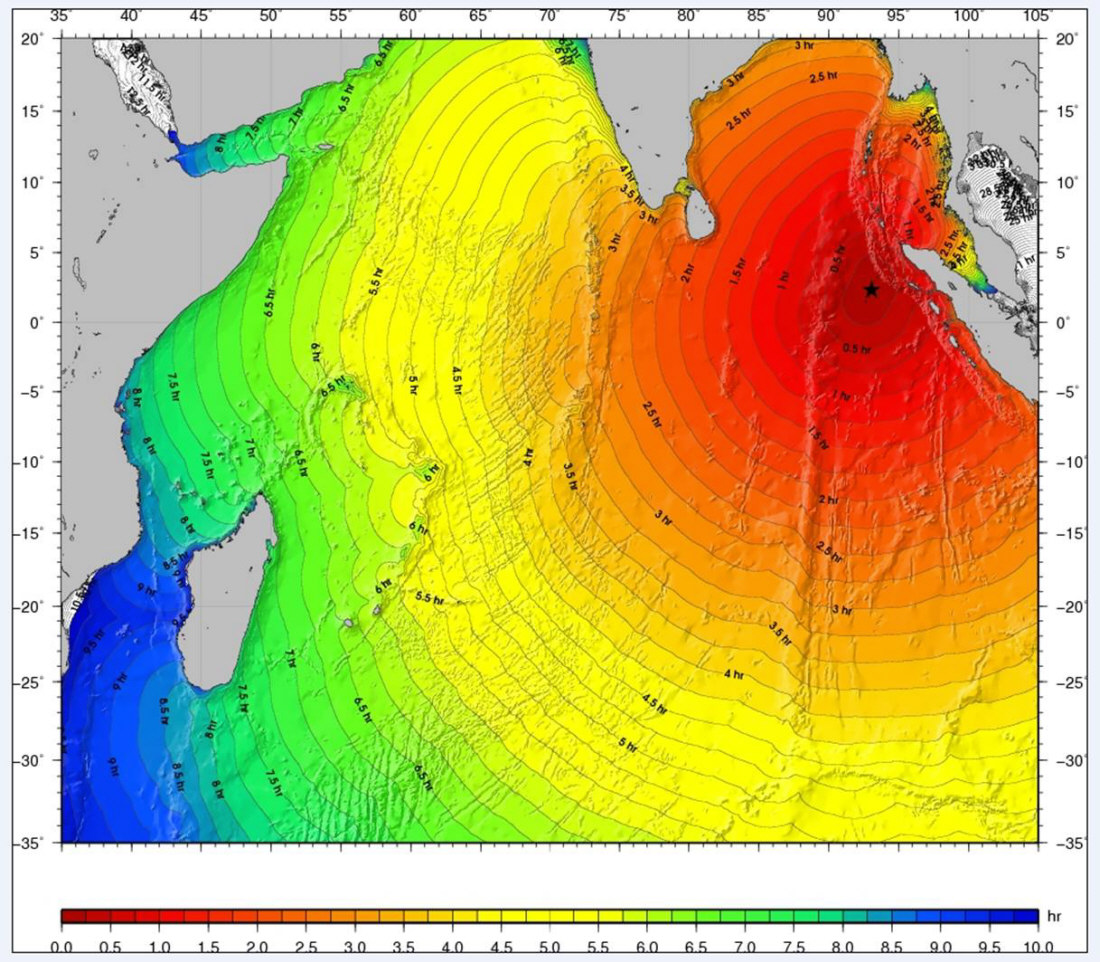
Figure 4: Map of the travel times of the tsunami through the Indian Ocean, obtained by considering the fault model as a line of point sources (source CEA/DAM, simulation performed with TTT software (GeoWare).
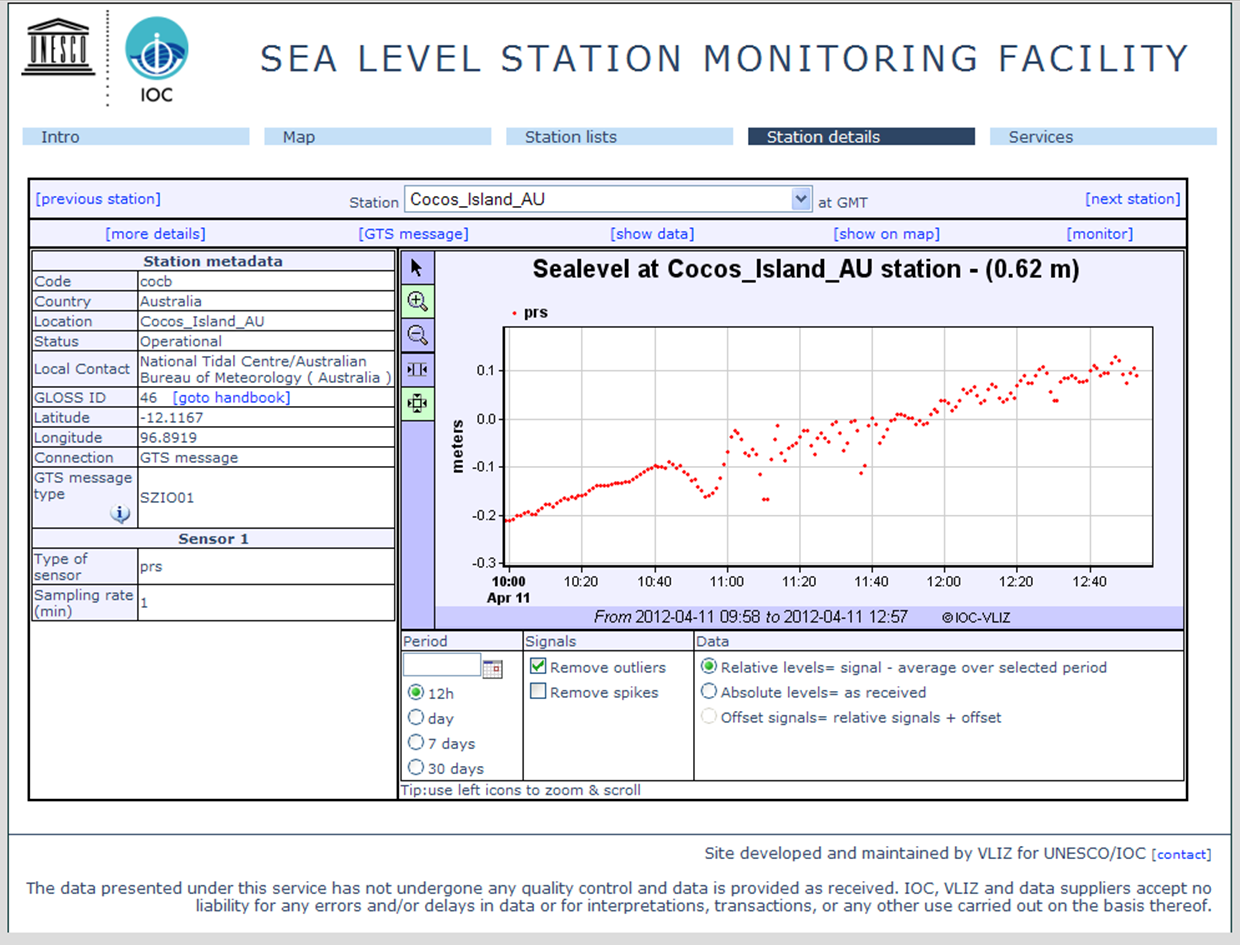
Figure 5: Tide-gauge recording at Coco island (Indian Ocean). The tsunami is actually measured, with an amplitude of approximately 20 cm.
 Preliminary results of seismic source analysis Preliminary results of seismic source analysis
The source of the main shock is analysed by trying to account as fully as possible for the signals recorded at great distances on worldwide networks of seismic stations (IRIS and CEA). This approach, also known as kinematic inversion, allows us to obtain a precise description of the seismic source, i.e. how the rupture is propagated on the fault (method of patches; Vallée and Bouchon: Imaging co-seismic rupture in far-field by slip patches, JGI, 2004). This analysis is important because, in addition to confirming the magnitude, it provides the characteristic dimensions of length, duration and slip necessary to understand and simulate a potential tsunami. In this approach, we reconstruct displacements of the compressional (P) and shear (HS) body waves to place better constraints on the seismic source.
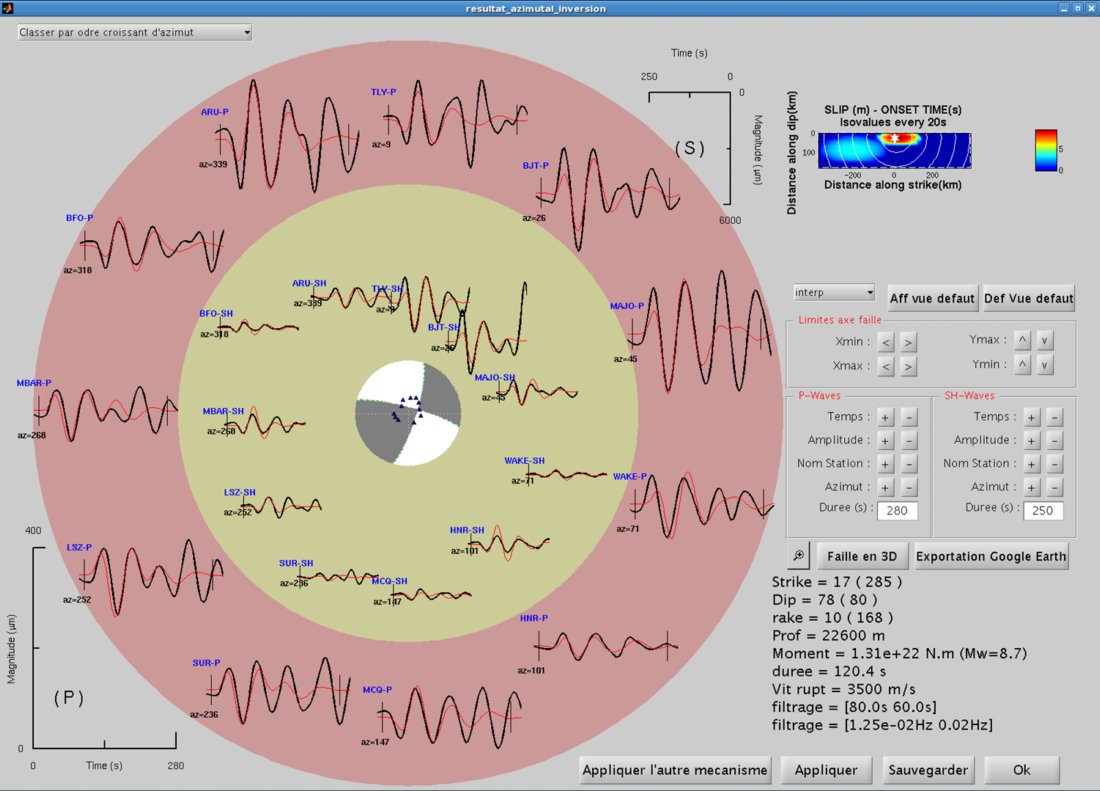 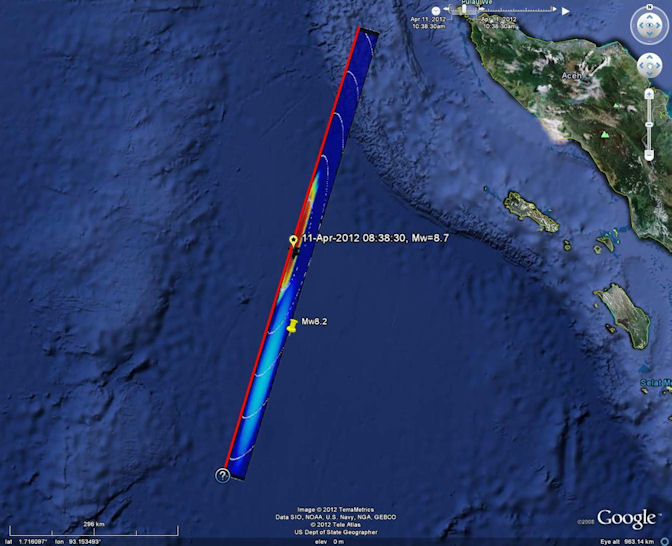
Figure 6: Inversion of the earthquake on 11 April 2012 at 8h38 UTC. The results yield a source magnitude of 8.7 with two rupture zones, the main rupture being located at the hypocentre, with a maximum slip of at least 9 m (source CEA/DAM).
The kinematic inversion using the long-period seismic sensor data (CEA and IRIS) yields a focal mechanism associated with a strike-slip fault, a magnitude of Mw=8.7 and an epicentral depth of 22 km (Figure 6). The rupture consists of two slip patches. The main patch is at the level of the hypocentre and displays a bilateral rupture pattern (ruptures occurring to the north and south of the hypocentre). The duration of the rupture is approximately 120 seconds. The maximum slip of at least 9 m occurred mainly at the level of the hypocentre. Similar results are obtained by other organizations ( https://geoazur.oca.eu/spip.php?rubrique787).
Preliminary seismotectonic analysis
Although located in the same region as the great earthquakes of 2004 (Sumatra-Andaman Mw 9.2) and 2005 (Deplus, Mw 8.7), the two major seismic events of magnitude Mw 8.7 and Mw 8.2, which occurred in the North-eastern Indian Ocean on 11 April 2012, show very different mechanisms. In fact, these recent earthquakes were generated by strike-slip motion related to a particular tectonic context.
Indeed, seismological observations show that pronounced intraplate seismicity exists in the North-eastern Indian Ocean, far away from subduction-type plate boundaries (Sumatra-Java) or extensional mid-ocean ridges (Figure 7). This setting is comparable to a diffuse plate boundary (Robinson et al., 2001; De Mets et al., 2005). In particular, this applies to the Wharton Basin (W on Figure 7), which is located to the east of the 90°E Ridge and south-west of the Sumatra-Java trench.
This diffuse deformation occurs in response to the particular compressional stress regime inherited from the collision between India and Asia (65 My ago); the oceanic plates situated behind the collision zone are deformed according to regimes that are quite different to the west and to the east of the 90°E Ridge. In the Wharton Basin, recent geophysical data actually confirms the tectonic activity of major strike-slip faults (Deplus et al., 1998; Robinson et al., 2001). Ancient fracture zones were formed in this region during the last phase of oceanic accretion, which ended less than 45 My ago (Singh et al., 2011, Figure 8). These inherited fault systems are now reactivated according to a sinistral strike-slip motion, which generated, for example, the earthquake of 2000 (Robinson et al., 2001) (Figure 7). In a similar setting, to the north of the Wharton Basin, the earthquake of 11 April 2012 (Mw 8.7) was followed 2 hours later by a second rupture located farther south (Mw 8.2). Both of these ruptures occurred along a practically N-S oriented principal plane (Figure 8).
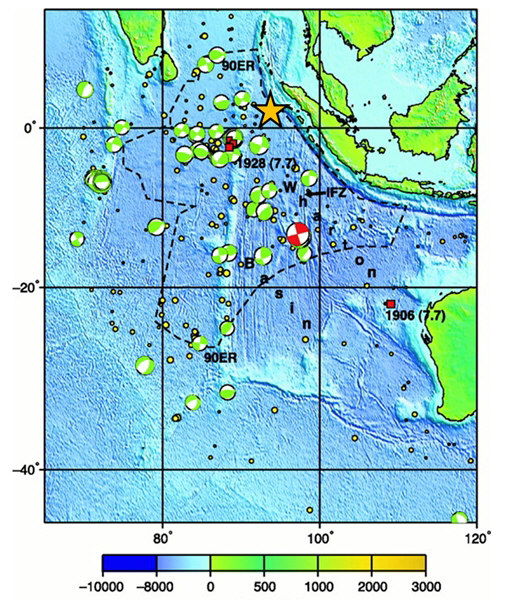
Figure 7: Known intraplate seismicity since 1904 in the Wharton Basin. The focal mechanism in red refers to the strike-slip earthquake of 2000 (Mw 7.8). The rupture of 11 April 2012 is indicated by an orange star (modified after Robinson et al., 2001).
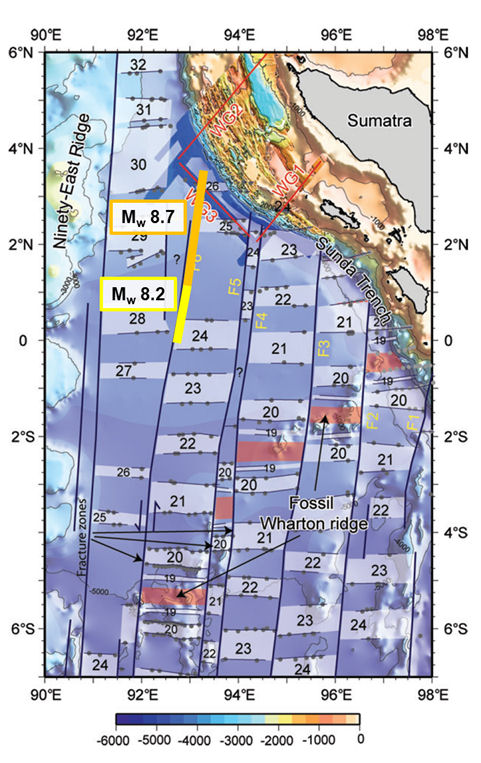
Figure 8: Bathymetry and magnetic anomalies in the Wharton Basin. The ruptures associated with the Mw 8.7 and Mw 8.2 events are located in the north of the Basin, close to an old reactivated fracture zone (modified after Singh et al., 2011).
|
)
)
)
)
)
)
)