 |
 |
 |
|
 |
|
|
|
SCIENTIFIC FILES |
|
|
| |

|
Magnitude-5.3 seismic event on 7 April 2014 to the North East of Barcelonnette |
 1 Location of the event
On 7 April 2014 at 19h27 UT, the Detection and Geophysics Laboratory (LDG) located an earthquake of magnitude ML = 5.3 with an epicentre situated west of Saint-Paul D'Ubaye (Alpes de Haute Provence). This earthquake occurred in the Embrunnais-Ubaye Massif, an area affected regularly by moderate seismicity (Figure 1). Its epicentre is close to that of the seismic event of 5 April 1959, which had an epicentral intensity of VII-VIII and magnitude M=5.3, representing the strongest earthquake ever recorded in the French Alps. The location determined for the earthquake reported here is also very similar to the event of 26 February 2012 with magnitude ML = 4.8 (Mw=4.1), which was widely felt throughout South-eastern France (Courboulex et al., 2013).
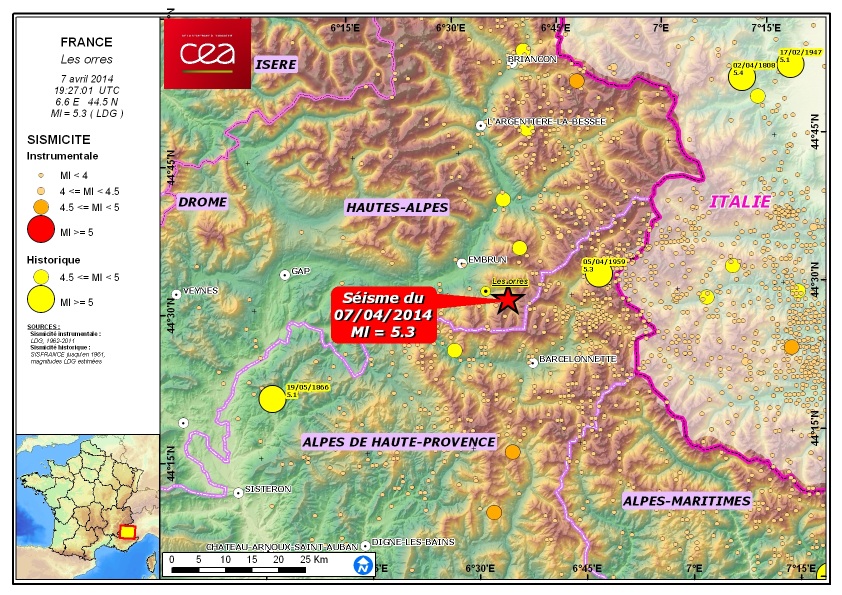
 Figure 1: General map showing seismicity.
2 Characteristics of the seismic source
Inversion of the moment tensor allows us to determine how the seismic waves were propagated at the level of the fault rupture.
In the case of the Barcelonnette earthquake, the focal mechanism determined from the polarities of the first arrivals (Figure 2) yields a normal fault mechanism characteristic of an extensional regime, associated with a fault having a weak dextral strike-slip component.
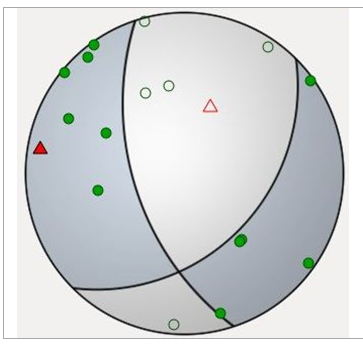
Figure 2: Focal mechanism of the event determined from polarities of the first arrivals (expressed in terms of azimuth/dip/slip, the two planes of this mechanism are NP1: 162/63/-131 and NP2: 45/48/-38).
The focal mechanism obtained by inversion of the waveforms at regional distances is consistent with the result obtained by reversing the polarities. (Figure 3)
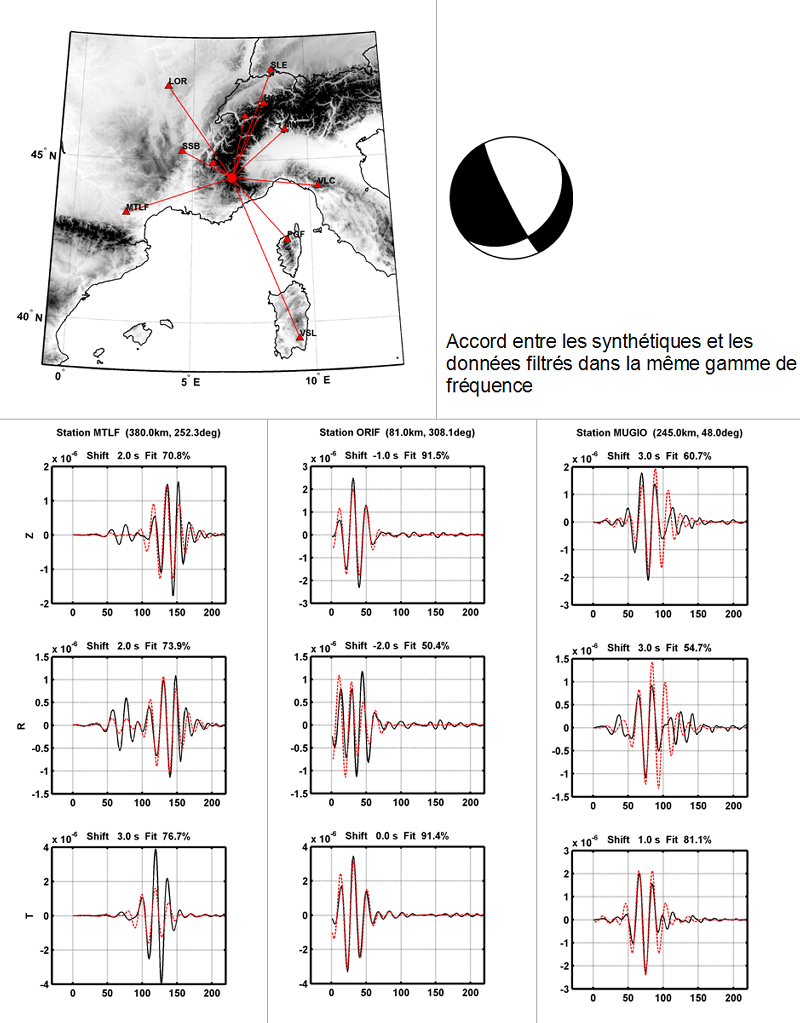
Figure : Inversion of wavefoms with periods between 15 and 30 s (Strike/Dip/Rake = 50°/30°/- 15°, MW = 4.87).
The 8 km depth is constrained by the presence of deep seismic phases (PPP and sP) on stations at teleseismic distances.
A moment magnitude Mw of 4.78 can be determined for this event using a method based on coda waves (Denieul et al., 2014) (Figure 4).
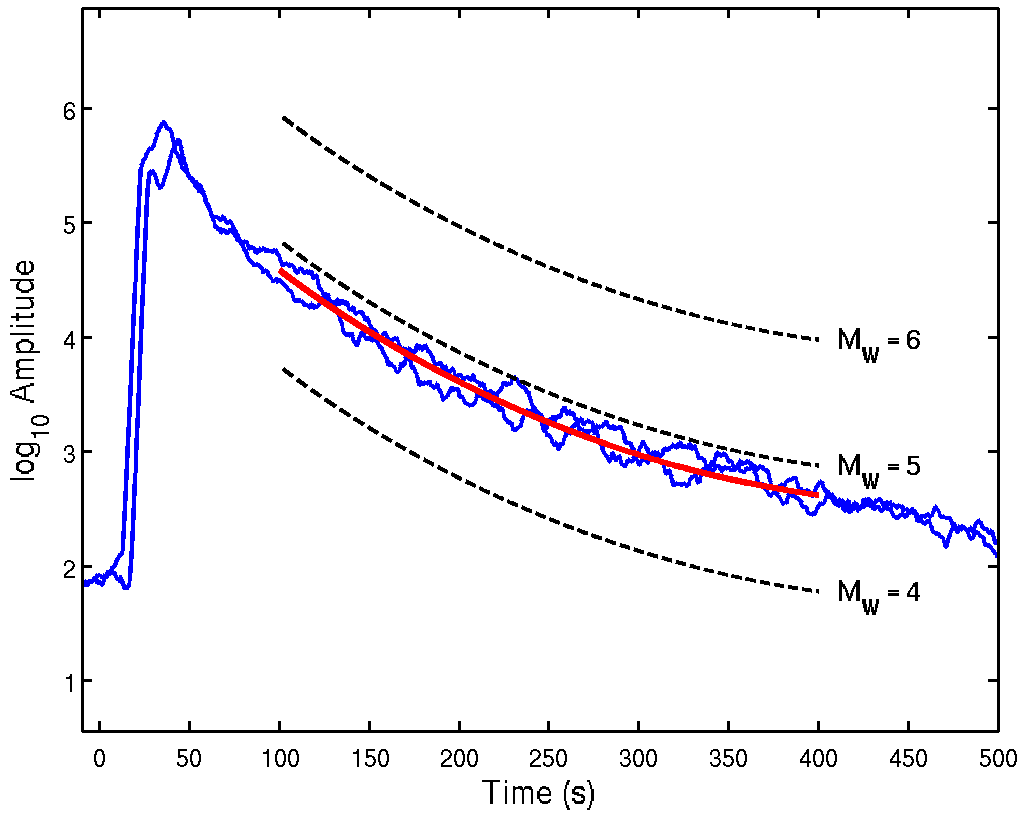
Figure 4: Envelopes of recordings of the event at stations FRF and LMR. The black dotted lines represent the coda-wave model used for various earthquake amplitudes (Denieul et al., in preparation). The coda method yields a moment magnitude MW of 4.78 (±0.04) for this event, defined by the red line.
3 Seismic sequence
The earthquake was followed by a sustained seismic sequence. As of 8 April at 14h00 local time in Metropolitan France, the CEA/DASE recorded 68 aftershocks. None of these events exceeded magnitude ML = 3.5.
4 Seismo-tectonic analysis
The focal mechanism for the event of 7 April 2014 (Figures 2 and 3) is very similar to solutions obtained for the earthquakes of 1959 and 2012 (Figure 5), and agrees with slip on a normal fault striking NW-SE (dipping 65° towards the West) having a small dextral strike-slip component, or its conjugate fault striking NE-SW with a weaker dip towards the east.
Although these two fault directions are present in the Ubaye Massif (e.g. Sue et al., 2007; Sanchez et al., 2010), the NW-SE trend (N130 to 160) is nevertheless more marked (Figure 5). It should be noted that some of the faults near the earthquake are suspected to have been active during the Quaternary (e.g. the Serenne Fault or the Font Sancte Fault, a conjugate fault described by Sue et al., 2007, see Figure 5).
Some of these faults are the seat of dense seismic swarms and have developed over relatively long intervals of time. The best studied and nearest of these swarms (more than 16,000 small earthquakes located over the period 2003-2004 by Jenatton et al., 2007) extends over a length of 9 km at depths ranging between 3 and 8 km, which is close to the depth estimated for the earthquake of 7 April 2014. This swarm shows a NW-SE orientation on a westward dipping plane that is very similar to plane 1 of the focal mechanism (Figure 5).
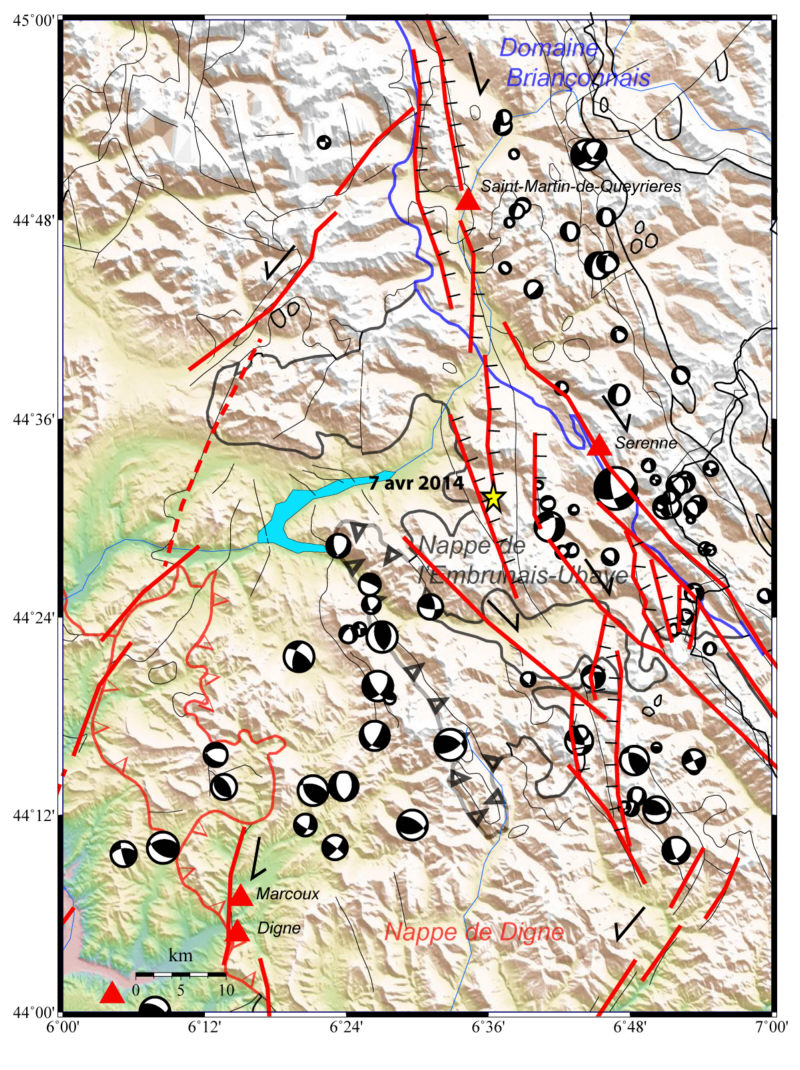
Figure 5: Tectonic sketch map of the area affected by the earthquake of 7 April 2014. Location of earthquake epicentre (red star) determined by LDG. The traces of faults (both active and inactive) are taken from the 1:1,000,000 geological map of France (BRGM). The red triangles indicate sites where neotectonic activity has been reported (source: NEOPAL 2012; Sue et al., 2007). The black and white circles represent a geometric synthesis of focal mechanism diagrams characterizing slip planes associated with the strongest instrumental earthquakes in the area, with symbol diameter proportional to the magnitude of the event. The sources of the focal mechanisms are primarily derived from studies on data from the SISMALP and LDG networks.
Postseismic unit
Share your eye-witness account of this earthquake
Courboulex et al. (2013) High-Frequency directivity effect for an Mw 4.1 earthquake , widely felt by the population in Southeastern France, Bull. Seim. Soc. Am., 103 (6) doi: 10.1785/0120130073.
Jenatton et al. (2007) The 16,000-event 2003-2004 earthquake swarm in Ubaye (French Alps), Jour. Geophys. Res. 112, B11, B11304 DOI: 10.1029/2006JB004878.
NEOPAL, 2012 base de donnée nationale d’indices Néotectoniques et Paléosismiques www.neopal.net
Sanchez G., Y. Rolland, D., Schreiber D., Giannerini G ., Corsini M. Lardeaux J.-M. (2010). The active fault system of SW Alps. Journal of Geodynamics 49 (2010) 296–302.
Sue, C. et al. (2007) Extensional neotectonics around the bend of the Western/Central Alps: an overview INTERNATIONAL JOURNAL OF EARTH SCIENCES, 96 ( 6), 1101-1129.
Denieul M., Sèbe O., Cara M. and Y. Cansi. (2014) MW estimation from crustal coda-waves recorded on analog seismograms (en préparation).
Denieul, M., Sèbe, O., and M. Cara, 2013. Crustal coda waves properties in France and magnitude calibration, IASPEI meeting, Götheborg July 22-26, 2013.
|
|
|
)
)
)
)
)


