 |
 |
 |
|
 |
|
|
|
Scientifiques files |
|
|
| |

|
Earthquake of magnitude 8.3 off the coast of central Chile and associated tsunami |
An earthquake of magnitude MW 8.3 took place on Wednesday 16 September 2015 at 22h54 Universal Time (19h54 local time, 00h54 Paris time). The Chilean authorities issued a tsunami alert for the whole coastline of the country. Less than half an hour after this large-magnitude earthquake, an aftershock of magnitude MW 7.0 was also recorded. In the 4 hours following the main shock, 15 aftershocks of magnitude greater than 5.0 were detected and located. French Polynesia was placed under “vigilance alert” in the Marquesas archipelago, since the Polynesian Tsunami Warning Centre (PTWC, Pamatai Geophysics Laboratory, Tahiti) estimated that waves slightly higher than 1 m could locally impact the zone, but no tsunami alert was issued.
|
CHARACTERISTICS OF THE EARTHQUAKE: |
|
|
MAGNITUDE |
Mw 8.3 (calculated from 38 stations) |
|
AREA |
at sea, to the West of Illapel on the coast of Chile |
|
DEPTH |
10 km |
|
LATITUDE |
- 31.560° |
|
LONGITUDE |
- 71.580° |
|
ONSET TIME |
22:54:33 YOU |
|
Cities in Chile closest to the epicentre:
Illapel, 46 km to the W
Salamanca, 68 km to the WNW
La Ligua, 105 to the NW
Ovalle, 116 km to the SSW
Santiago, 229 km to NW
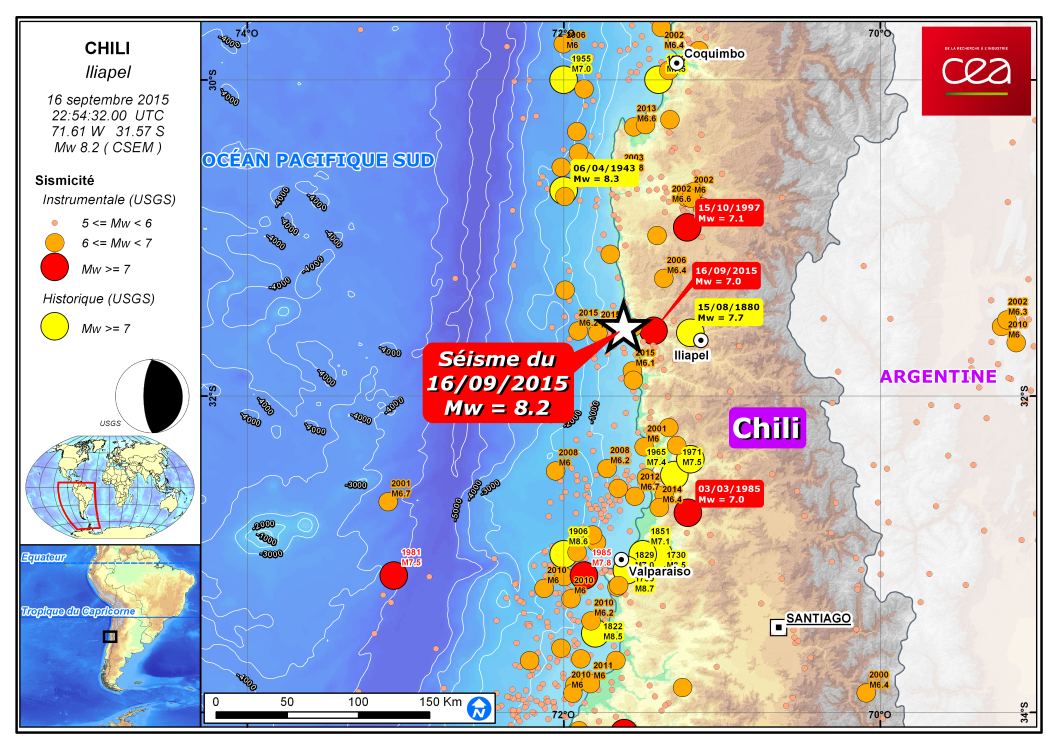
 Figure 1: Map showing location of the earthquake of 16 September 2015 and historical seismicity of the region.
 1. Reminder of the seismotectonic context
The magnitude-8.3 earthquake of 16 September 2015 occurred at the level of the central Chile subduction zone, at the interface between the Nazca and South-American plates. In this zone, the oceanic Nazca plate is being subducted towards the ENE under the South-American plate at a rate of 74 mm/year. The Peru-Chile trench is located 85 km to the west of the earthquake of 16 September, marking the line where the Nazca plate begins to be subducted. Chile has a long history of devastating earthquakes related to subduction, such as the Maule event in central Chile in 2010 (M 8.8), which ruptured a segment of the inter-plate boundary extending over a length of approximately 400 km to the South of the present shock. This subduction zone is also distinguished by the occurrence of the largest earthquake ever recorded, which took place in 1960 in Southern Chile (M 9.5). Looking at the seismicity over the last 100 years, the area within a radius of 400 km around the 2015 event has recorded 15 other earthquakes of magnitude greater than 7. Several of these events generated transoceanic tsunamis.
2. Source mechanism
The data received from the seismic stations were used by the PTWC to determine the earthquake mechanism by inversion of the W-phase at teleseismic distances (Kanamori and Rivera, 2008). This solution gives a moment magnitude of 8.2. The mechanism obtained (Figure 2) shows a source having a mainly reverse-fault component. The nodal planes of the double couple give an almost North-South azimuth and a weak dip towards the east. The centroid location is 31.06°S, 71.69°W.
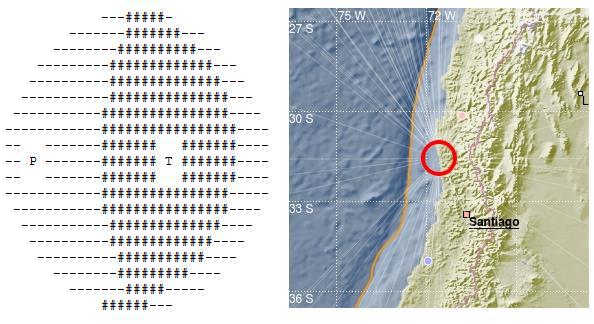
Figure 2: Focal mechanism of the earthquake obtained by inversion of the W phase at teleseismic distances.
3. Tide-gauge/marigraph observations and tsunami simulation
This earthquake had a significant tsunamigenic potential: it involved a reverse-fault mechanism which could produce considerable deformation leading to a major tsunami. At Coquimbo, waves were generated attaining an amplitude of 4.75 m. In the areas impacted by the tsunami, measurements of the rise in sea level ranged from a few tens of cm up to 5 m locally along the Chilean coasts.
Maximum heights observed by the PTWC on various Chilean tide gauges:
• Coquimbo: 5.0 m at 23:49 UTC on 2015-09-16
• Pichidangui: 1.8 m at 23:15 UTC on 2015-09-16
• Juan Fernandez: 1.1 m at 00:22 UTC on 2015-09-17
• Valparaiso: 0.7 m at 00:23 UTC on 2015-09-17
• San Antonio: 0.7 m at 23:31 UTC on 2015-09-16
• Huasco: 0.7 m at 23:53 UTC on 2015-09-16
A simulation of the estimated arrival time of the tsunami was carried out by the PTWC, indicating an impact of the first wave on Polynesia between 9 and 12h after the earthquake (Fig. 3). The maximum wave heights of the tsunami in the open ocean obtained by digital simulation are also represented. Note the good correspondence between this model and the recordings of DART buoys (Fig. 4).
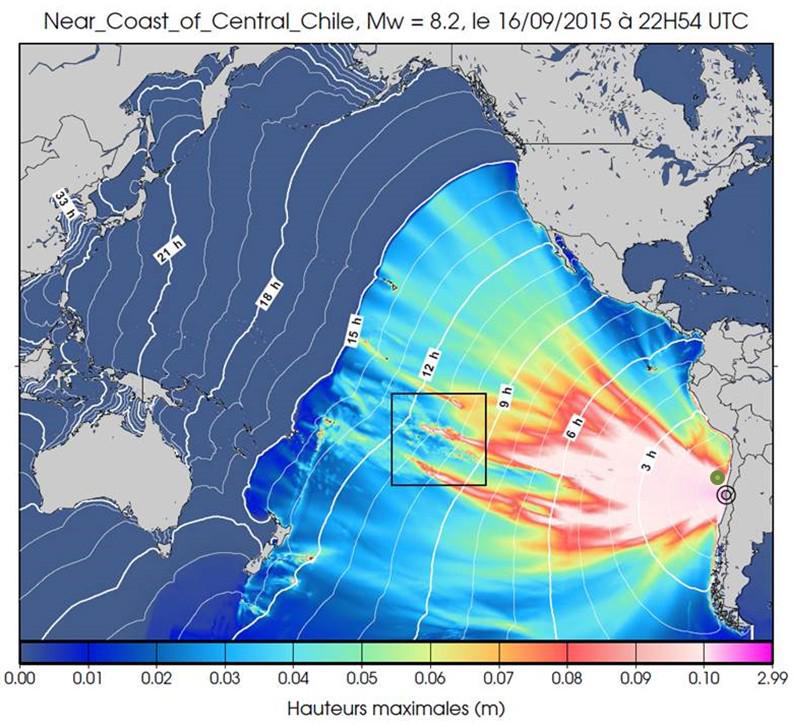
Figure 3: Maximum heights (colours) and estimated travel times of the first wave (white isochrons) of the tsunami generated by the earthquake of 16 September 2015 near the coast of Chile (PTWC simulation). The green point indicates the position of DART buoy at station 32402, whose data are presented in Fig. 4.
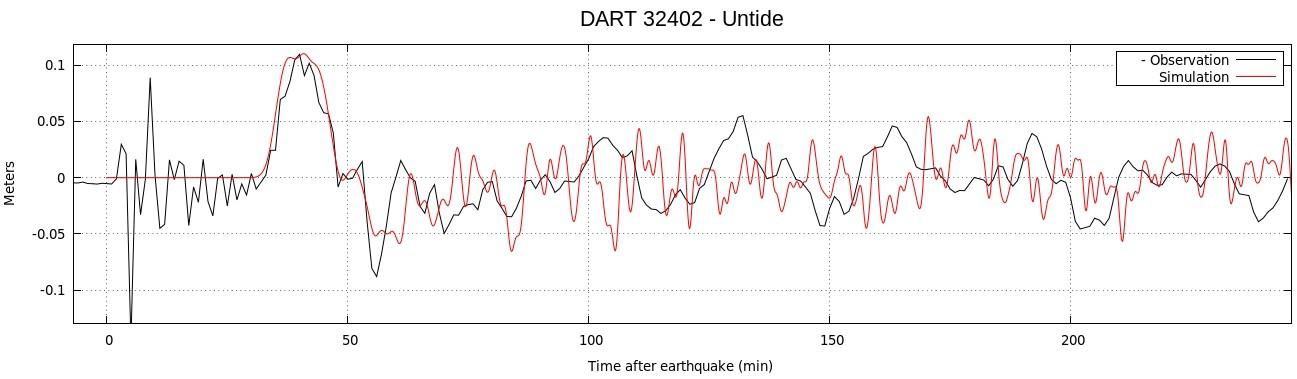
Figure 4: Comparison between recording obtained at the DART 32402 buoy (26.743°S; 73.983°W) and synthetic model of the tsunami presented on Fig. 3 (PTWC).
The Marquesas archipelago was placed under “vigilance alert”, the PTWC having estimated maximum wave heights of between 30 cm and 3 m (Fig. 5). According to the Civil Protection Department, significant draining out and filling were observed in the bay of Tahauku on Hiva Oa.
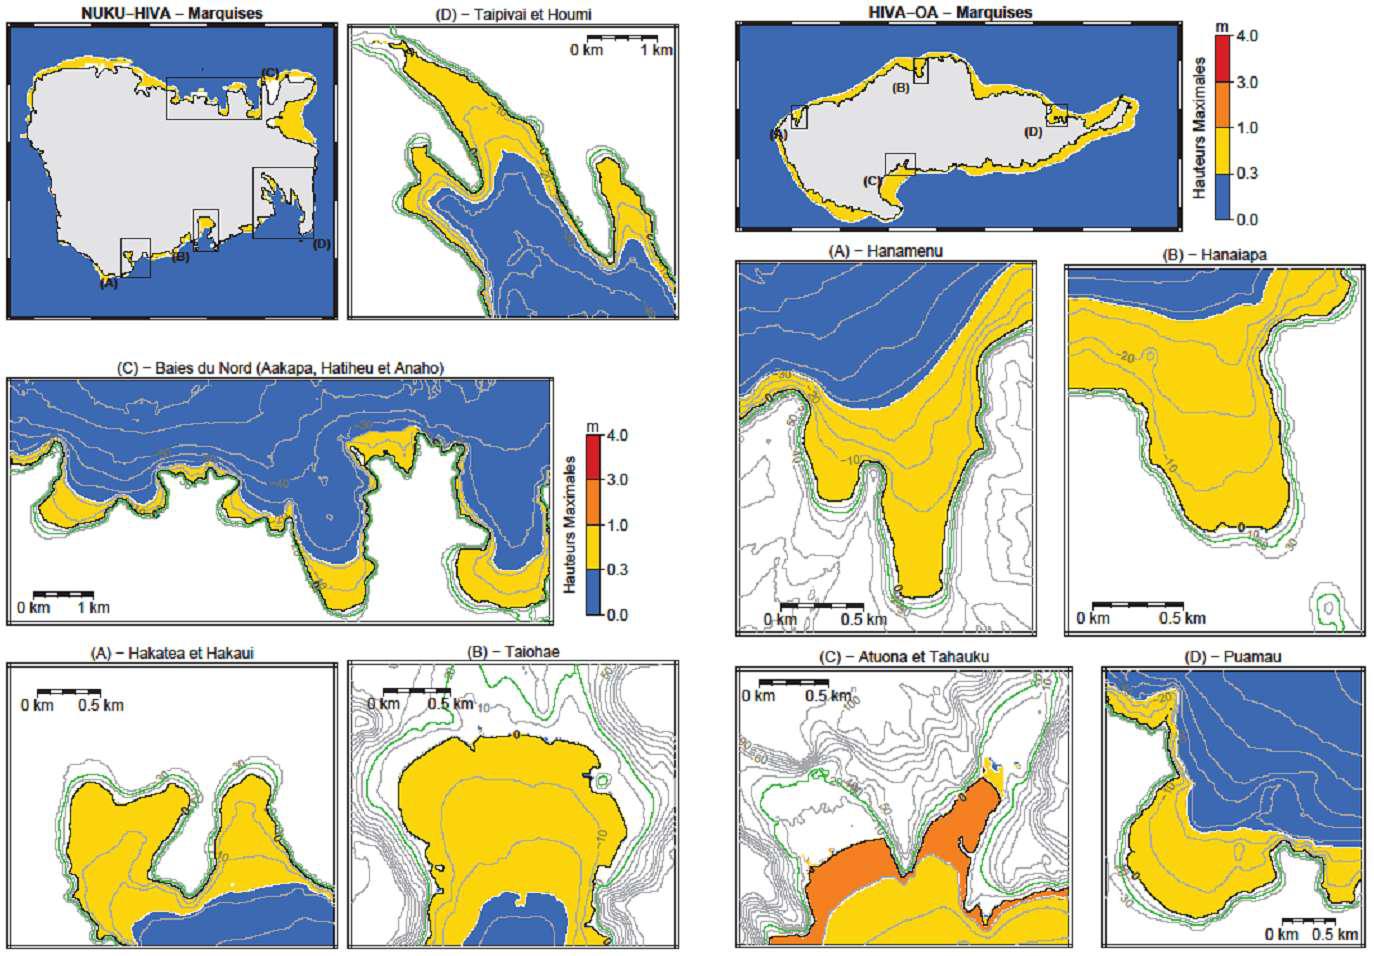
Figure 5: Synthesis of estimated maximum wave heights of the tsunami of 16 September 2015 expected in French Polynesia, for Nuku Hiva and Hiva Oa in the Marquesas (numerical modeling by PTWC).
The tsunami was also observed on real-time tide-gauge/sea level measuring stations of the CENALT
The recordings from pressure sensors or radar sensors (sampling step of 1 min) were collected together on the Web site of the IOC (www.ioc-sealevelmonitoring.org) and then processed for several Chilean and Polynesian stations (Fig. 6). The filtered signal (middle curve, in red) shows maximum peak-to-trough amplitudes of 2 to 5 m on the Chilean coast. In Polynesia, the first waves are observed with amplitude of approximately 45 cm at Rikitea, 25 cm at PAPEETE, and with a peak-to-trough height of more than 2 m at Nuku Hiva. The spectrogram indicates that this phenomenon is associated with a period of approximately 10 to 20 min.
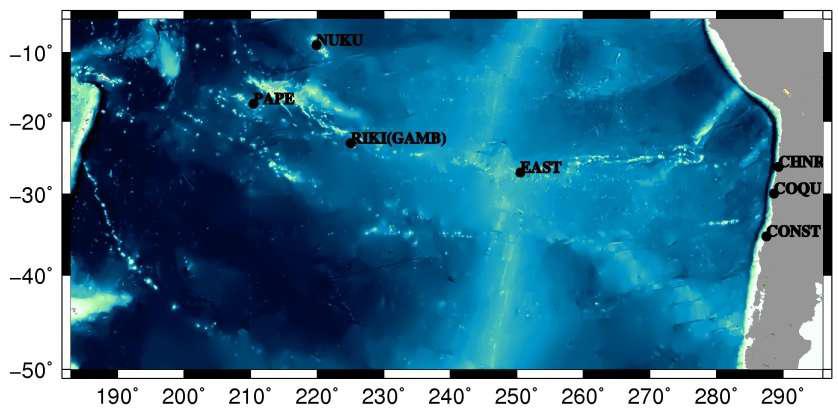
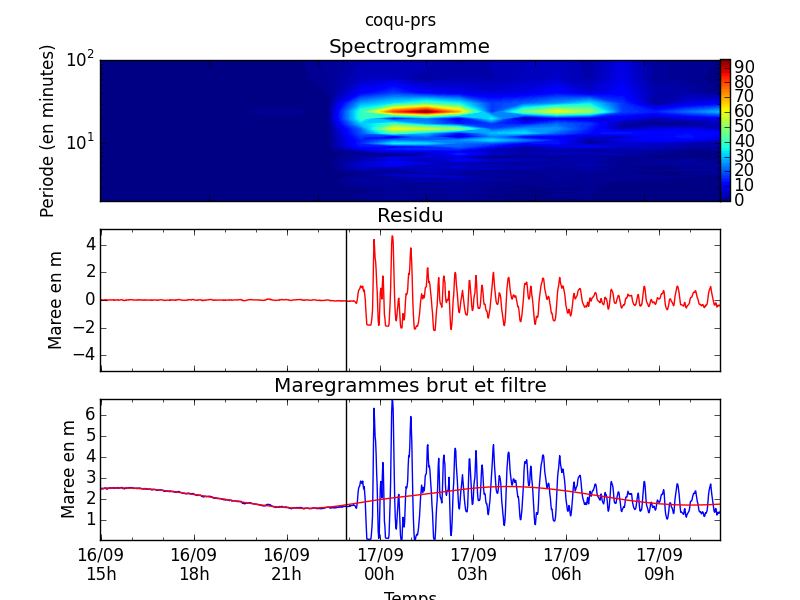
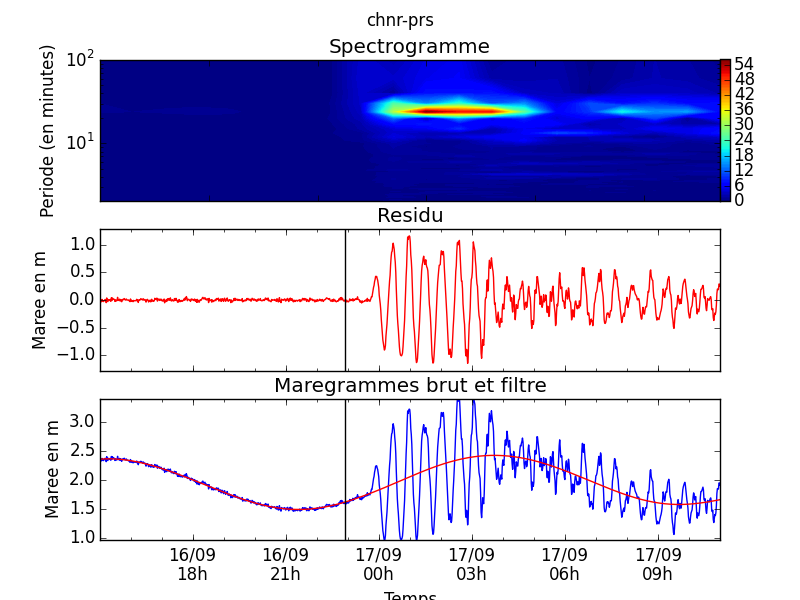
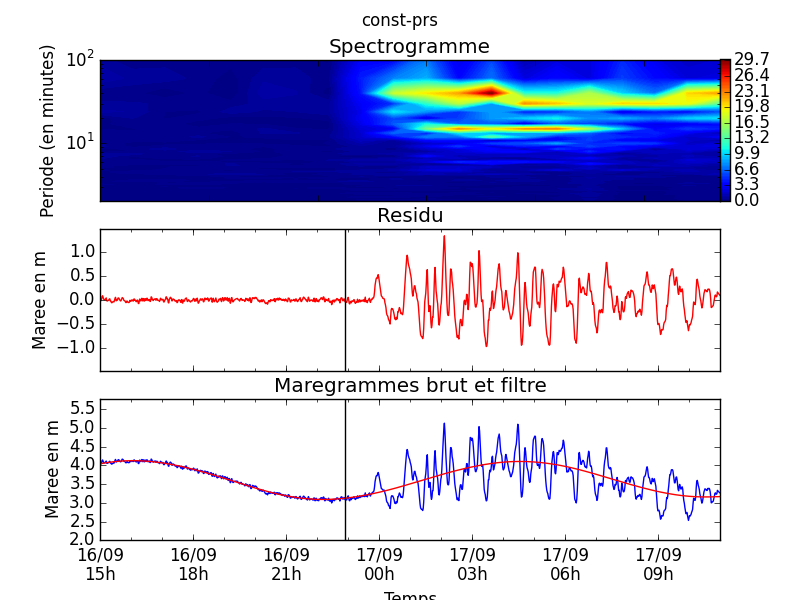
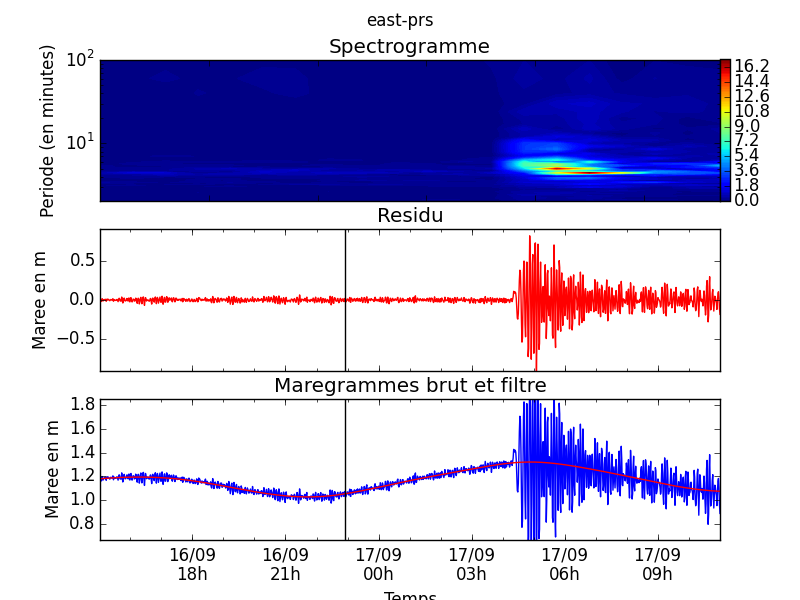
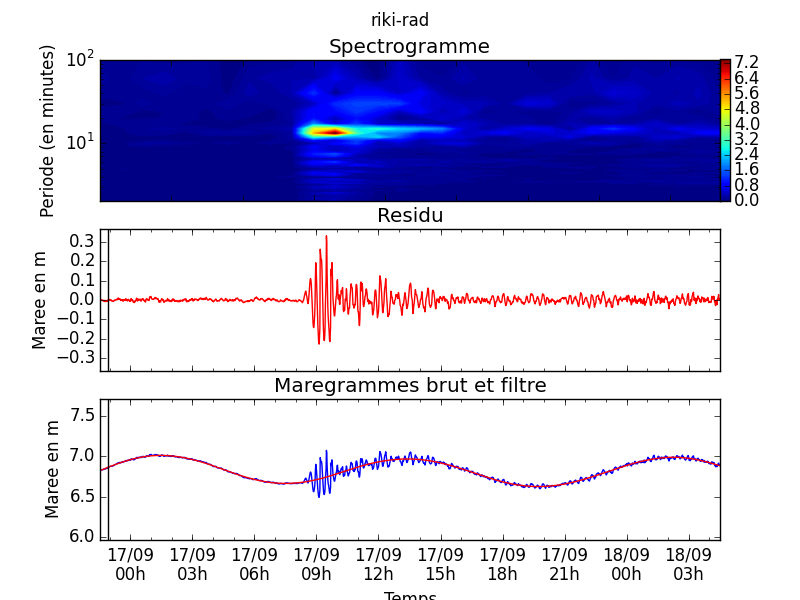
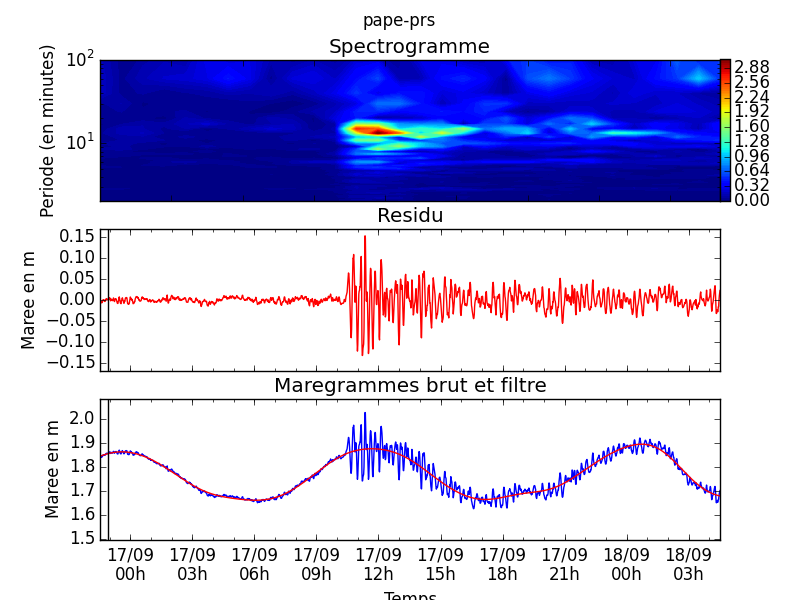
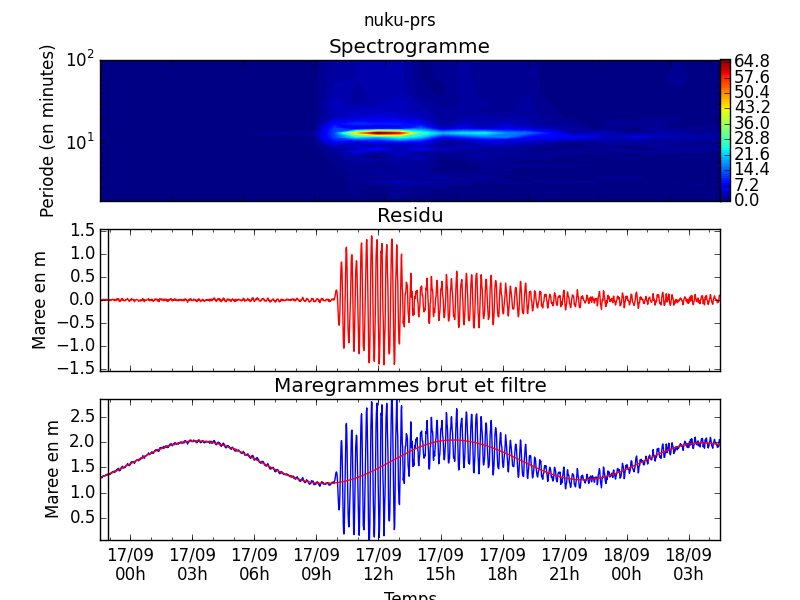
Figure 6: Processing of tide-gauge/marigram data from Coquimbo (COQU), Constitucion (CONST), Chañaral (CHNR), Easter Island (EAST), Rikitea/Gambier (RIKI), PAPEETE (POPE) and Nuku Hiva (Nuku) over the period of the earthquake of 16 September 2015, carried out at CENALT (localization of stations shown on map at top). The black vertical line indicates the onset time of the earthquake.
|
|
|
)
)
)
)
)
)
)
)
)
)
)
)
)