 |
 |
 |
|
 |
|
 |
|
|
|
Seismicity monitoring |
|
|
|
Page being translated ...
As part of its environmental monitoring duties, the CEA's military applications Division (Direction des Applications Militaires, DAM) monitors seismicity on French national territory (seismic alerts) and in the rest of the world. Seismic station networks have been set up in France and overseas for this purpose. Additionally, due to France's involvement in the CTBTO (Comprehensive Test-Ban Treaty Organization) it has near real-time access to the data of numerous stations overseas. These data are processed to produce earthquake bulletins and conduct numerous seismological studies. Thanks to this expertise, the DAM's environmental assessment andmonitoring Department (Département analyse, surveillance, environnement, DASE) has won recognition in the international arena. |
|
|
|
 The seismic station network The seismic station network |
|
|
|
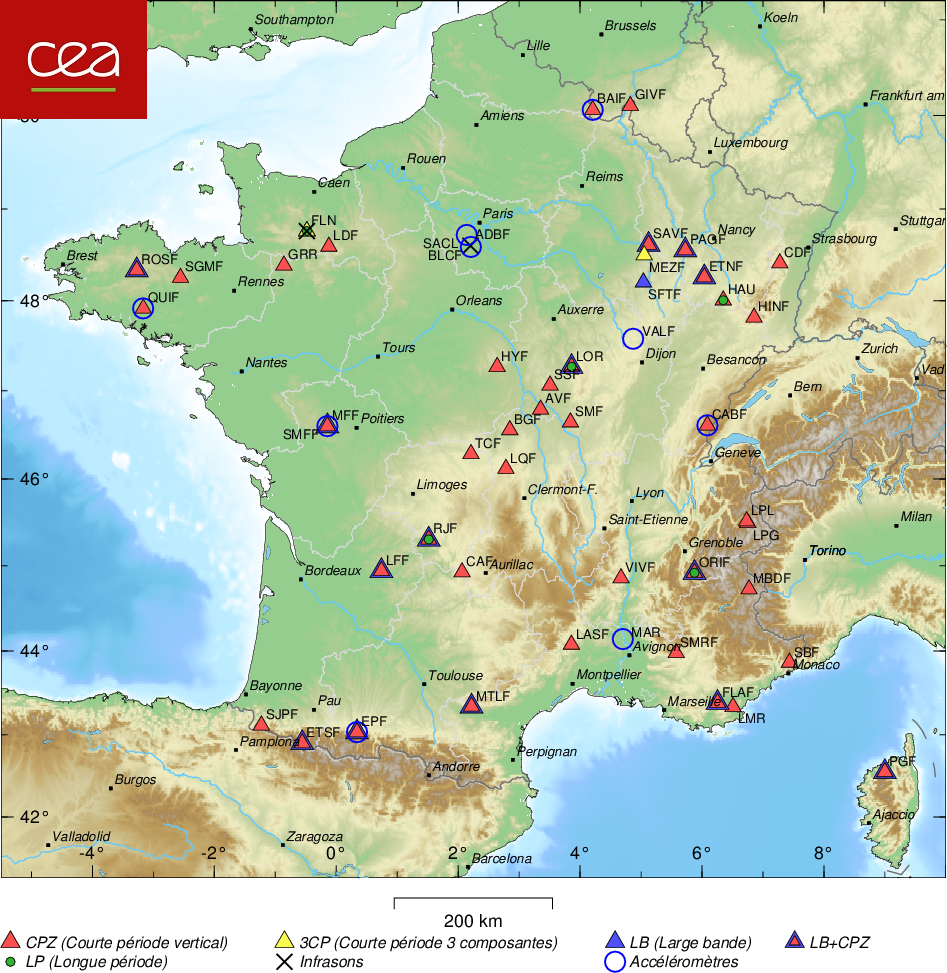
Initially set up for detection purposes in the late 1950s, the Laboratory for Detection and Geophysics (LDG) seismograph network began with the installation of three stations in Normandy. Three others quickly followed in the Morvan. Subsequently, the network underwent development and nowadays comprises more than forty stations spread throughout mainland France (including Corsica).
 |
DASE seismic network in 2021. |
The above map shows network development according to the date on which the stations were set up (designated by their internationally recognized 3 to 4 character code). The base network (blue dots) gradually developed from the end of the 1950s up until 1976. After a period of slow development (red dots), coverage of France was improved in 1995, with the installation of stations in Brittany, Ardennes, the Pyrenees, and, to a certain extent, the Alps (black dots). The latest development took place in 2001, with, in particular, installation of three stations in Champagne (mauve dots).
Data produced by these stations are transmitted in real time to the Bruyères-le-Châtel site for centralization, recording and processing. |
|
|
|
Routine processing |
|
|
|
The purpose of these processes is to extract as much information as possible from the signals received from the stations, including detection, location, magnitude determination and characterization of recorded events. There are two parallel process types: a fast automatic process and a deferred interactive process, which is far more comprehensive and precise.
Automatic processing
These processes involve real-time searches for events by studying energy variations in the recordings received from each station, and temporal coherence between these variations. When such events are detected, the arrival times of the different seismic waves are sought and an automatic location is determined. Magnitude is calculated from the amplitudes measured on the signals.
When certain criteria (geographical, magnitude thresholds) are reached, the duty seismologist is automatically notified in order to alert the authorities.
Interactive processing
These processes, performed in delayed mode, are based on the same principles. The events are sought with the help of both the automatic processing results, and by viewing all the signals on-screen. The second method is used to detect certain events, which are generally of low magnitude, not detected by automatic systems. It is also used to exclude quarry blasts, which are far more numerous than earthquakes. These are generally of little interest and not relevant for seismicity catalogs.
The analysts record the seismic wave characteristics precisely, using a variety of graphic tools: inter-signal correlation, spectral processing, particle motion studies for the three station components (vertical, north-south and east-west), and relative locations, etc. Precise locations can therefore be achieved thanks to the analysts' experience and the use of external data.
All the measurements (arrival times, amplitudes, azimuths) performed at the stations, together with the characteristics of the events (coordinates, magnitude, type), are published in weekly seismic bulletins that are made available to the seismology community.
Certain particularly interesting earthquakes are covered by more in-depth studies.
The number of events processed over time is shown in the following histogram. Four distinctive periods are indicated by arrows.
Prior to 1976, events were processed from "hardcopy" archives, as part of the process to draw up a seismotectonic map of France.
Later on, with the widespread use of computers, systematic processing of all seismic data with the aim of publishing bulletins became possible, enabling fast location calculations and the storage of large amounts of data in digital form.
The second growth period, in the late 1980s, corresponds to the time when computer screens replaced hardcopy records, previously produced using rulers, pencils and erasers. This had the effect of improving analysis capabilities and precision.
|
The number of earthquakes processed over time. |
The third step, towards the mid 1990s, corresponds to the time when the network was renovated (digital satellite transmission, new stations in Brittany, the Alps and the Pyrenees).
The last development, in 2000, corresponds to a monitoring request from the north-east of France, which resulted in three additional stations.
The phenomenon is even more obvious in the above histogram, which shows the number of seismic phases read over time. In 1980, the average number of phases read per earthquake was 12. In 2002 this number was 24.
Histograms show improvements in earthquake detectability and location precision, particularly in the case of local and regional earthquakes. They are by no means a sign of an increase in seismicity. This development merely reveals an extension of the network and the use of more effective processing equipment.
|
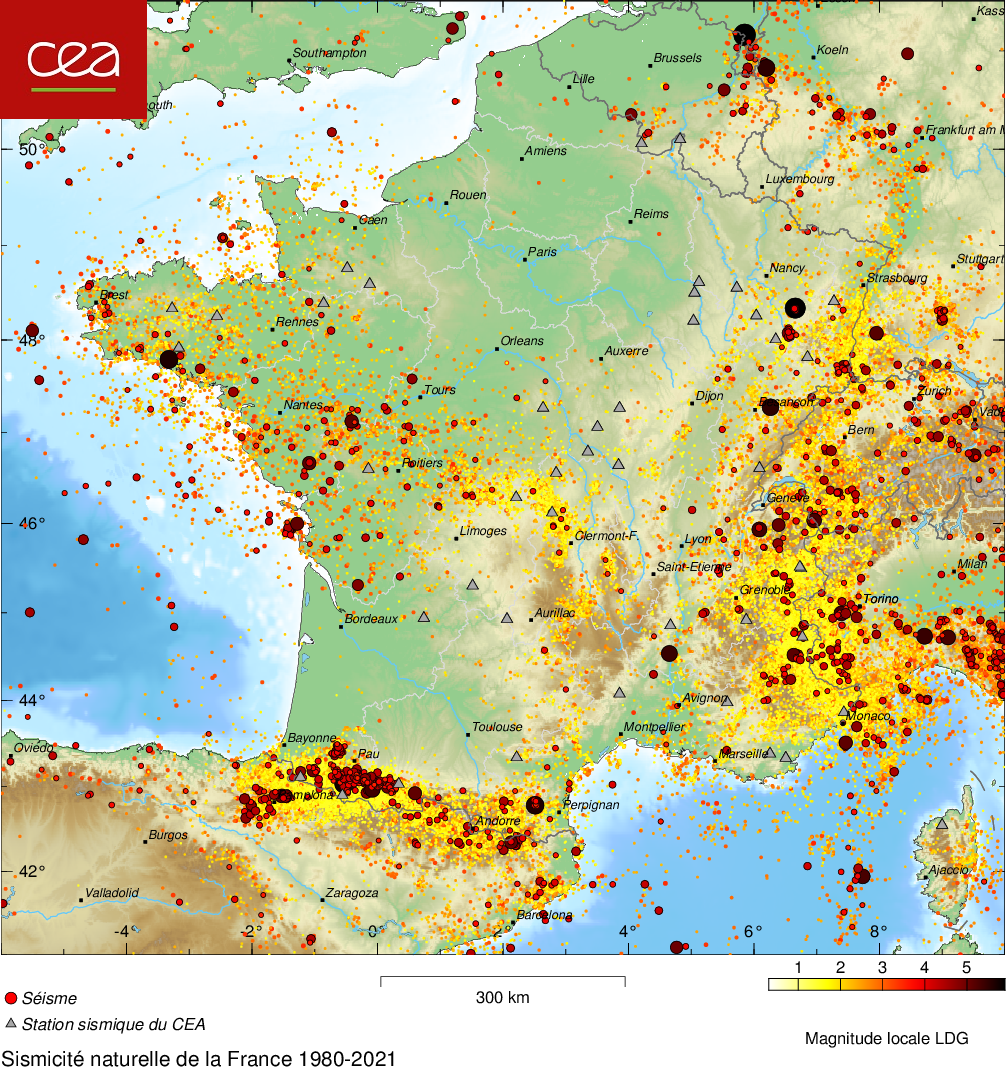
Natural seismicity in France between 1980 and 2021 (about 86 000 earthquakes). |
|
|
|
)