
 |
SUMATRA EARTHQUAKE AND TSUNAMI December 26, 2004
|
The earthquake (quick link to Initial displacement figure)
Tsunami propagation (quick link to GIF animation 7.3 MB)
Wave height (quick link to Figure)
References
 Description of the event Description of the event
On December 26, 2004 at 0:58 am (UT), i.e. 1:58 am in Paris and 7:58 am in Sumatra, one of the largest earthquakes ever recorded occurred with a magnitude currently estimated at Mw=9.0. Figure 1 represents the ground vertical displacement when the seismic waves accompanying the December 26, 2004 earthquake traveled through Europe. The ground vertical displacement reached an amplitude of 2 cm. Although exceptional, displacements such as these are not perceptible by humans, since the wavelength of the phenomenon is approximately one hundred kilometers.
Figure 1: Recording of the ground vertical displacement in Europe. The maximum displacement reached about 2 cm.
This earthquake triggered one of the largest tsunamis observed for a hundred years, at least in this part of the Indian Ocean.
Characteristics of the earthquake
As this event triggered the alert system operated by the European-Mediterranean Seismological Centre (EMSC), it was immediately located by the duty seismologist at the DASE. The location of this event (3.50° North, 95.72° East) was calculated using a set of nearly 300 measurements obtained from a large number of seismic stations. It locates the event off the north-west point of Sumatra Island. The magnitude of the event (estimated at 9.0) makes it the most significant event of this area since the setup of international seismic networks. In the hours that followed, numerous aftershocks (over 500) were detected by the DASE network, the largest one occurring the same day at 4:21 am (UT) and registering a magnitude of 7.3. All the aftershocks were located in an area covering more than 1000 km as far as the Andaman Islands (Figure 2).

Figure 2: Location of the aftershocks recorded until January 6. The main shock is indicated by a star; the rectangle gives an indication of the area ruptured by the shock.
Seismotectonic setting
The Sumatra Island area is a boundary area between two tectonic plates. The Indo-Australian plate is plunging beneath Sumatra Island at a rate of almost 5 cm/year (subduction zone).The deformation of the island's coastal area, caused by this rapid convergence, gives rise to very strong earthquakes. The 1833 event (magnitude ~9) and the 1861 event (magnitude ~8.5) thus ruptured the subduction interface for close to 500 and 250 km in the center of the island, releasing a series of elastic strains, that had been accumulating for several decades, during seismic slips of several meters' amplitude in the process.
More recently, the strong yet more moderate 1935 and 1984 earthquakes ruptured small areas adjacent to these major ruptures. On the other hand, no major seismic event had been recorded in the adjacent area to the North as far as the Nicobar and Andaman Islands, where the 1881 and 1941 (M~8) ruptures produced tsunamis.
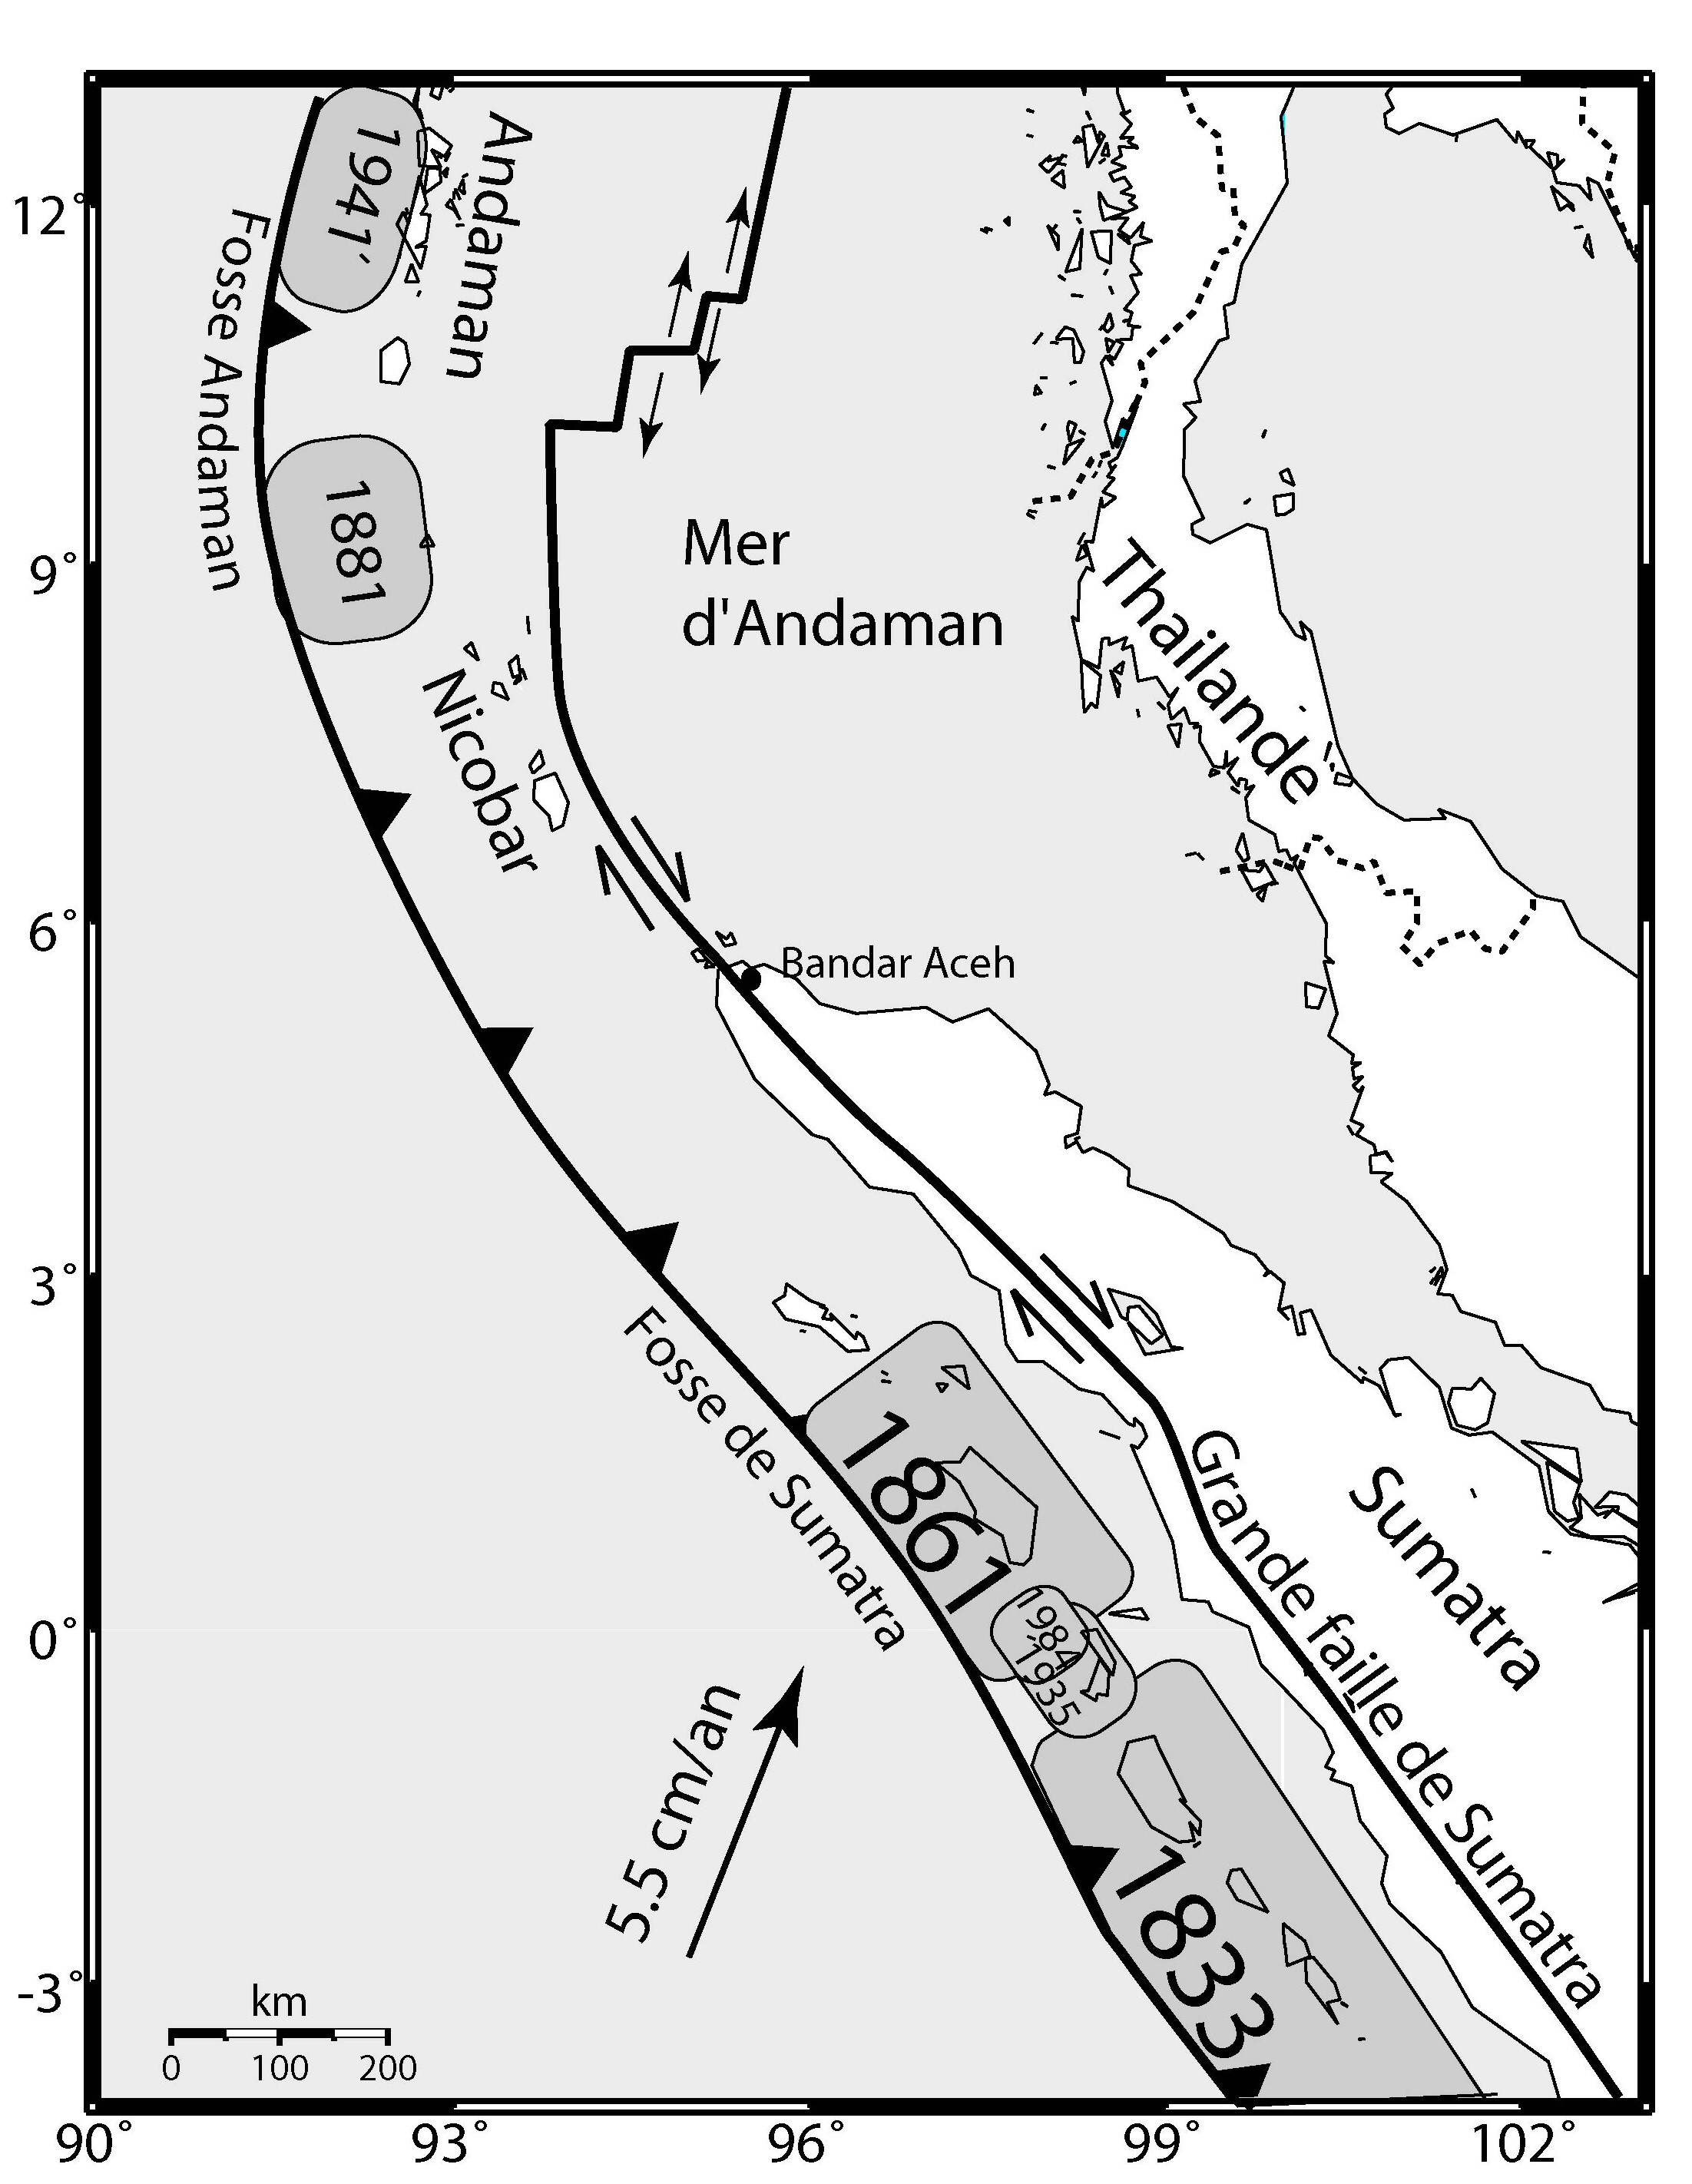
Figure 3: Seismotectonic map showing the location of the areas ruptured during the major earthquakes experienced in the area.
Detailed analysis of the event
The precise characteristics of this earthquake are not yet fully known, but some parameters, such as the focal mechanism, can be estimated at this stage. Several institutes are currently suggesting a mechanism whose main characteristic is a fault oriented at about 310° North. As far as the extension of the ruptured area is concerned however, points of view differ significantly from one institute to another, with fault lengths varying from 400 to almost 1000 km. According to our ongoing research on rupture modeling, it would appear that the ruptured fault size is around 600 km (Figure 2). This area clearly corresponds to the area not ruptured by the events that occurred in Sumatra in 1833 and 1861. The characteristics of the seismic source need to be determined more precisely with modeling work which will probably take several months.
Tsunami simulation
Although the characteristics of the seismic source are not yet fully known at present, a relatively accurate estimate of the main parameters is possible, enabling us to simulate the tsunami's propagation throughout the Indian Ocean.
Several tsunami source locations have been tested. These show that the effect of the tsunami in India and Sri Lanka is consistent with a fault spreading northwards from the epicenter of the earthquake to the Andaman and Nicobar Islands, with a direction oriented slightly more north-south. The distribution of the aftershocks presently known is also consistent with this geometry. The length could therefore reach 1000 km, but this value rather implies a magnitude of Mw=9.5, as for the Chilean earthquake in 1960. For a magnitude of Mw=9, empirical relationships instead suggest a value of 600 to 800 km with a breadth of about 100 km (Kanamori and Anderson, 1975) (Figure 4). As for the displacement along the fault, a value of 12 m may be considered (Scholz, 1982) (Figure 5).
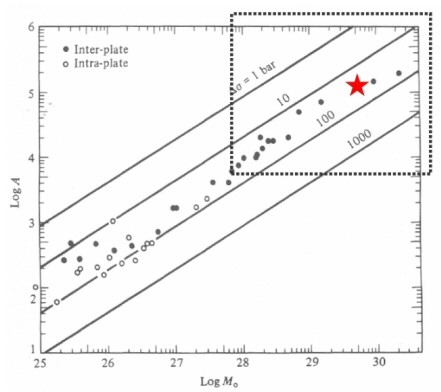
Figure 4: The red star indicates the earthquake that occurred in Sumatra in 2004. M0: seismic moment, A: fault surface
(Kanamori and Anderson, 1975).
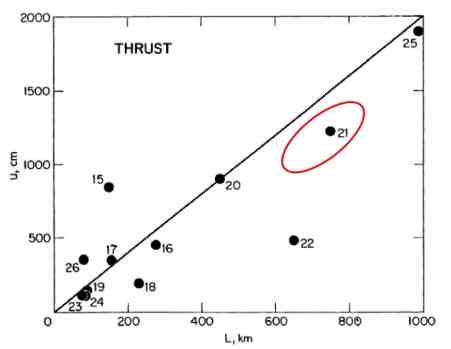
Figure 5: Relationship between the average displacement u and the lenght of the fault L for major earthquakes. The displacement of the Sumatra earthquake (red ellipse) can be estimated with relative accuracy at 12 m (according to Scholz, 1982).
The parameters required for tsunami modeling have been determined in view of the seismotectonic setting of the area and the preliminary results of the earthquake analysis. They are described in the chart below:
X, Y
(section center) |
Section extension (km x km)
|
Depth of center (km) |
Strike, dip, rake |
Moment (Nm) |
Mw |
Average slip (m) |
93.4°E 6.6°N
|
600 x 100
|
20
|
350° 12° 98°
|
3.7 1022
|
9.0 |
12.5
|
94.3°E 4.1°N
|
330° 12° 98°
|
Using the fault parameters described above, the vertical surface displacements are between -4 and 8 m (Figure 6).
This event should significantly contribute to the scientific debate on the theoretical relationships between different characteristic parameters, such as magnitude, fault dimensions, displacement, etc. - relationships that are poorly constrained due to the scarcity of this type of event.
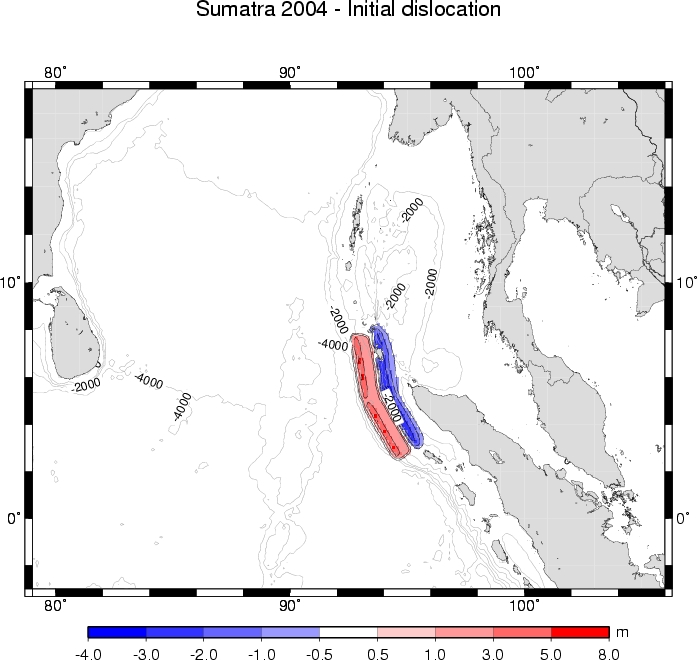
Figure 6: Map showing the initial ground deformation used for the tsunami propagation simulation.
Tsunami propagation
Propagation is modeled using a finite element method developed at the DASE (Heinrich et al., 1996; Heinrich et al., 1998; Hébert et al., 2001) that solves Navier-Stokes hydrodynamic equations. The speed of the tsunami can be approximately defined by the relationship c = (gh)1/2, where g is the acceleration due to gravity and h is ocean depth.
We used a bathymetric chart with a mesh size of 5' (side of about 10 km), obtained from an overall model resulting from altimetric measurements (Smith and Sandwell, 1997).
Figure 7: Animation simulating tsunami propagation in the Indian Ocean.
Reflection of the tsunami wave was particularly strong on the east coast of India and Sri Lanka.
Maximum wave heights
Figure 8 shows the effect of the tsunami throughout the Indian Ocean. The maximum wave height, calculated in deep water, varies from 5 cm to 3 meters. This wave height can be significantly increased when the tsunami reaches the coast depending on local bathymetry. This simulation shows that the energy is mainly radiated east- and westwards, which is consistent with the observed maximum effects.
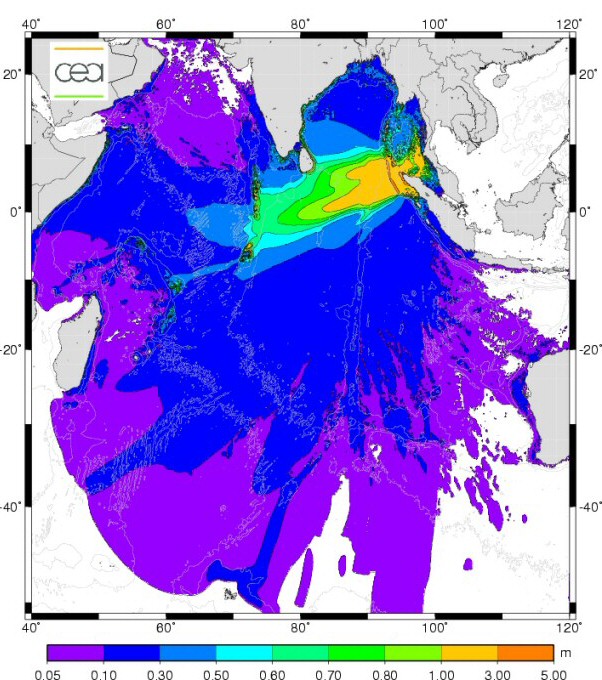
Figure 8: Map showing the maximum amplitude of tsunami waves in the Indian Ocean. The strong east- and westward directivity effect is noteworthy.
General informations about tsunamis
Literature providing information about tsunamis and their prevention is published by the Intergovernmental Oceanographic Commission of UNESCO can be found. They are available in English, French and Spanish on the website www.prh.noaa.gov/itic/.
References
. Hébert, H., P. Heinrich, F. Schindelé, and A. Piatanesi, Far-field simulation of tsunami propagation in the Pacific Ocean: impact on the Marquesas Islands (French Polynesia), Journal of Geophysical Research, 106, C5, 9161-9177, 2001.
. Heinrich, P., S. Guibourg, and R. Roche, Numerical modeling of the 1960 Chilean tsunami; Impact on French Polynesia,Physics and Chemistry of the Earth, 21, 19-25, 1996.
. Heinrich, P., F. Schindelé, S. Guibourg and P.F. Ihmlé, Modeling of the February 1996 Peruvian tsunami,Geophysical Research Letters, 25, 2687-2690, 1998.
. Kanamori, H., and D.L. Anderson, Theoritical basis on some empirical relations in seismology, Bulletin of the Seismological Society of America, 65, 1073-1095, 1975.
. Scholz, C.E., Scaling laws for large earthquakes: consequences for physical models, Bulletin of the Seismological Society of America, 72, 1, 1-14, 1982.
. Smith, W.H.F., and Sandwell, D.T., Global seafloor topography from satellite altimetry and ship depth soundings, Science, 277, 1956-1962, 1997.
(Adobe Acrobat Reader™)
|


