 |
 |
 |
|
 |
|
|
|
Dossiers scientifiques |
|
|
| |

|
Earthquake of magnitude 7.9 in the Santa Cruz islands on 6 February 2013 |
An earthquake of magnitude 7.9 occurred in the Santa Cruz islands on 6 February 2013 at 01h12 UTC. These islands are located at the south-eastern end of the Solomon Islands and to the north of Vanuatu. This strong-magnitude earthquake generated a local tsunami with a wave height of more than 2 m. This tsunami also reached the coasts of New Caledonia, where a local rise in water level was observed in excess of 1 m.
 Seismotectonic context
The earthquake of 6 February 2013 occurred on the boundary between the Australian plate (to the south-west) and the Pacific plate (to the north and east). The earthquake epicentre is located very close to the northern end of the Vanuatu subduction zone. The zone of rupture is situated in the Santa Cruz islands (Figure 1), where the Australian plate is being subducted beneath the Pacific plate towards the ENE at a mean velocity of about 94 mm/year.
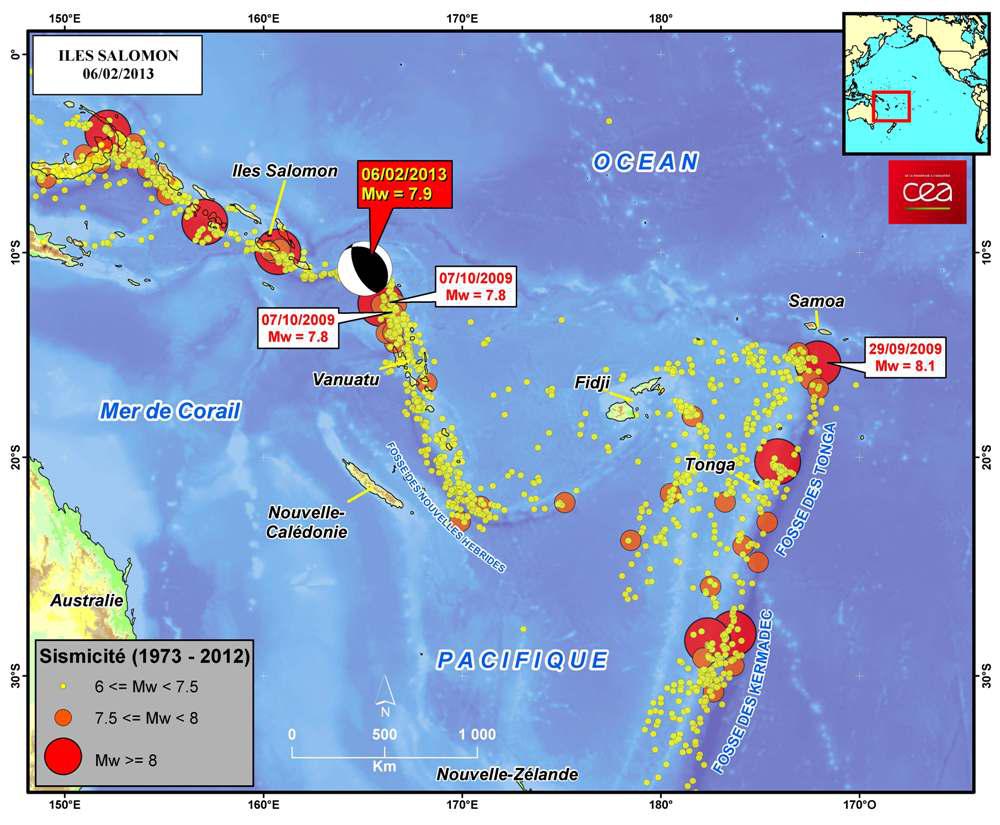
 Figure 1: map showing location of the earthquake of 6 February 2013 and seismicity (1973-2012) of the Solomon Islands, Vanuatu, Fiji, Samoa and Tonga.
The event of 6 February 6 2013 took place approximately 200 km to the north of a series of earthquakes that occurred in October 2009 along the Vanuatu subduction trench (the strongest event reaching a magnitude of 7.8). The epicentre is located approximately 700 km ESE from an earthquake of magnitude 8.1 that occurred in the Solomon Islands on 1 April 2007 and an event of magnitude 7.1 on 3 January 2010.
The Santa Cruz earthquake is situated in a complex region near the boundary between the Australian and Pacific plates. In this region, the Solomon trench in the west is connected to the Vanuatu trench farther south by a short segment with a dominantly sinistral strike-slip fault mechanism. The earthquake of 6 February is located at the northern end of the Vanuatu segment. To the west of the event epicentre, the plate boundary follows an almost East-West trend, and then joins up with the subduction zone along the Solomon Islands to the North-West.
Several tens of earthquakes occurred in the area around the epicentre during the month preceding the event of 6 February (more than 40 seismic events of magnitude 4.5 or stronger took place during the previous 7 days, including 7 events with magnitude greater than 6). These earthquakes show a mixture of different focal mechanisms (strike-slip, normal fault and thrust components).
Kinematic imagery of the seismic source (Figure 2)
The source of the earthquake of 6 February 2013 was analysed by trying to reproduce as precisely as possible the signals recorded at long distance by seismic stations belonging to the worldwide networks (IRIS and CEA). This approach, also called kinematic inversion, makes it possible to describe the seismic source in great detail, i.e. how the rupture was propagated on the fault (using the method of patches - Vallée and Bouchon: Imaging co-seismic rupture in far-field by slip patches, JGI, 2004. (Scardec). In addition to confirming the magnitude, this analysis allows us to determine the characteristic dimensions of length, duration and slip, which are necessary to understand and simulate a potential tsunami.
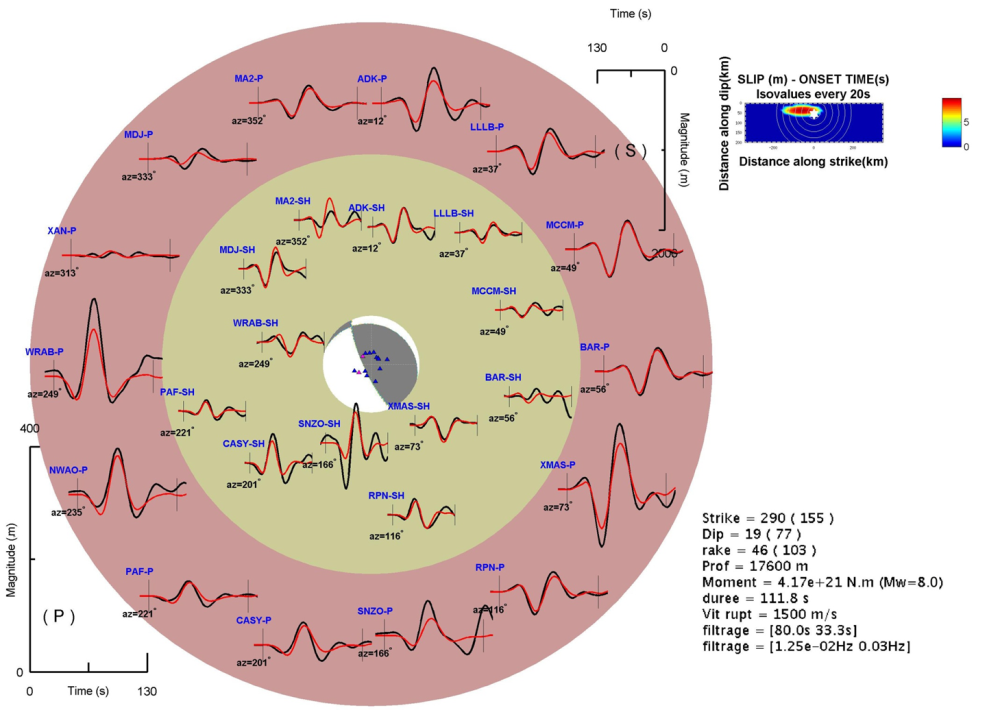
Figure 2: inversion of the earthquake of 6 February 2013 at 1h12 UT. The results yield a source magnitude of 8.0 with a main rupture zone approximately 100 km in length.
The oblique mechanism (thrusting with sinistral component) is fully consistent with the plate movements at the level of the Santa Cruz islands.
Tsunami generated by the earthquake
The dimension of the source (magnitude 8 with a rupture length of approximately 100 km), the focal mechanism (in particular, importance of the thrust component) and the relatively shallow depth of the event (approximately 18 km) all favoured the generation of a tsunami, which reached the Solomon Islands in less than one hour (Figure 3), and which was observed on many tide gauges.
The preliminary models show a marked directivity not only towards Australia, but also towards New Caledonia (Figure 4). These models are adjusted with respect to observable variables that are available, in particular, from the DART 55012 buoy in the Coral Sea (Figure 5 and location on Figure 4).
The animation of maximum wave heights attained at any point during the propagation highlights the effects of focusing towards New Caledonia and the Loyauté islands.
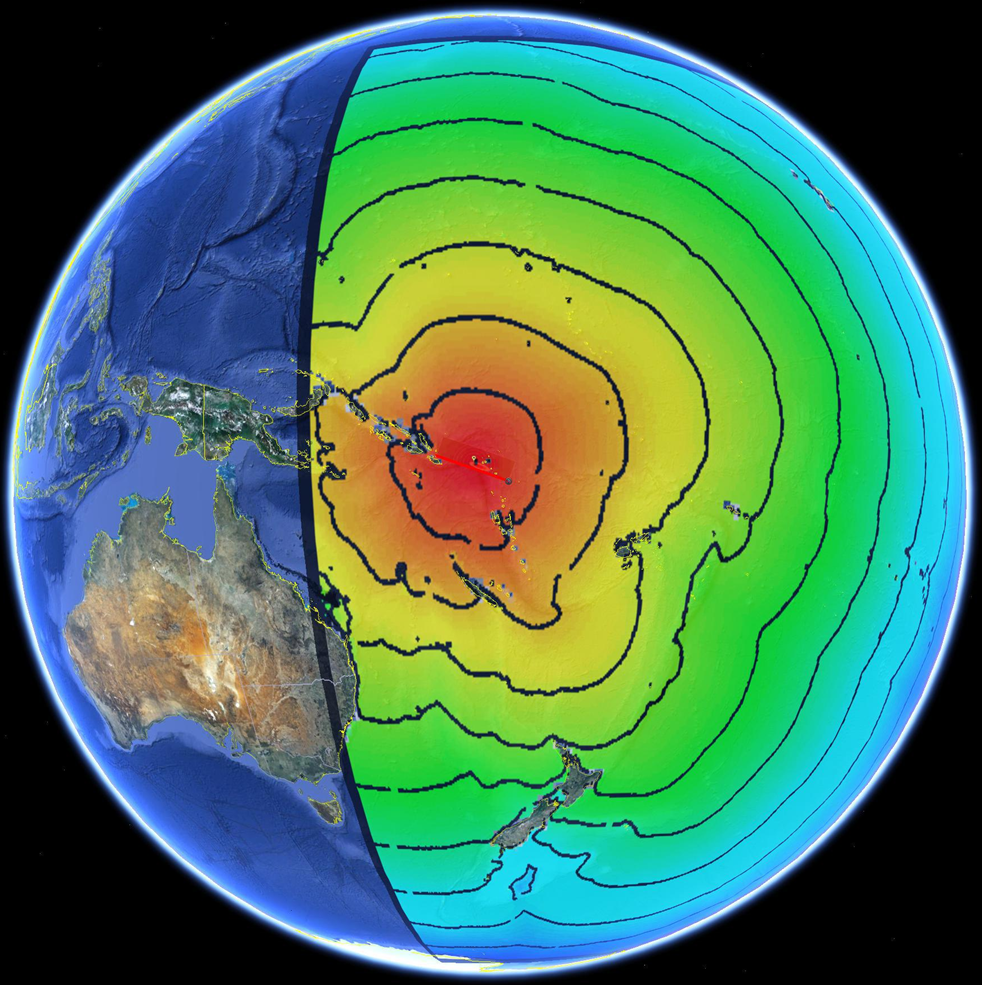
Figure 3: simulation of tsunami propagation (calculation of tsunami travel time, with contour interval: 1h).
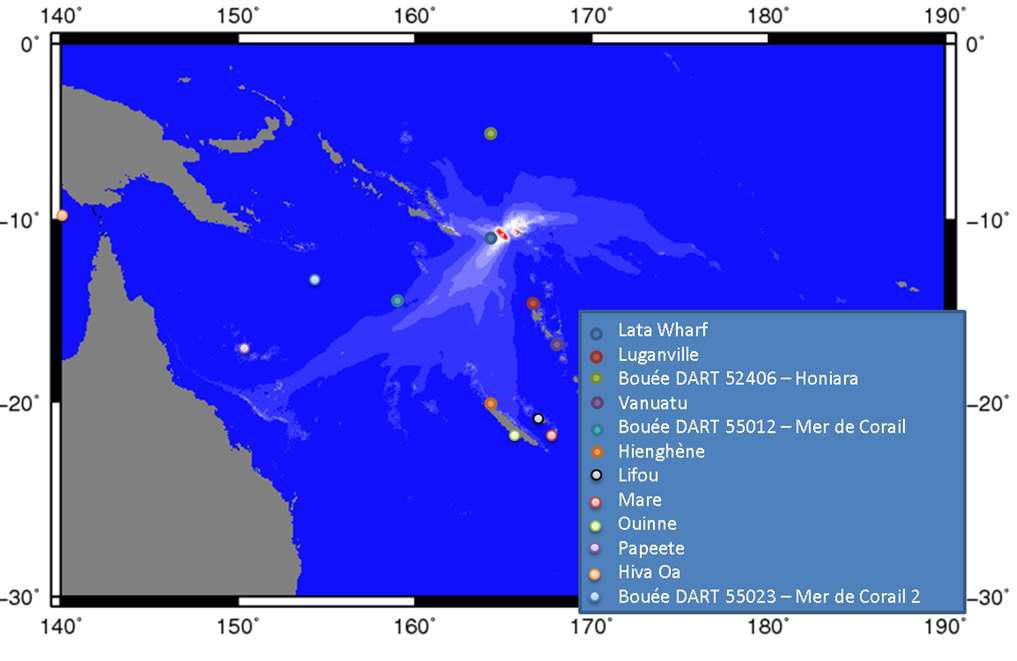
Figure 4: maximum wave heights of the tsunami in the open ocean obtained by digital simulation.
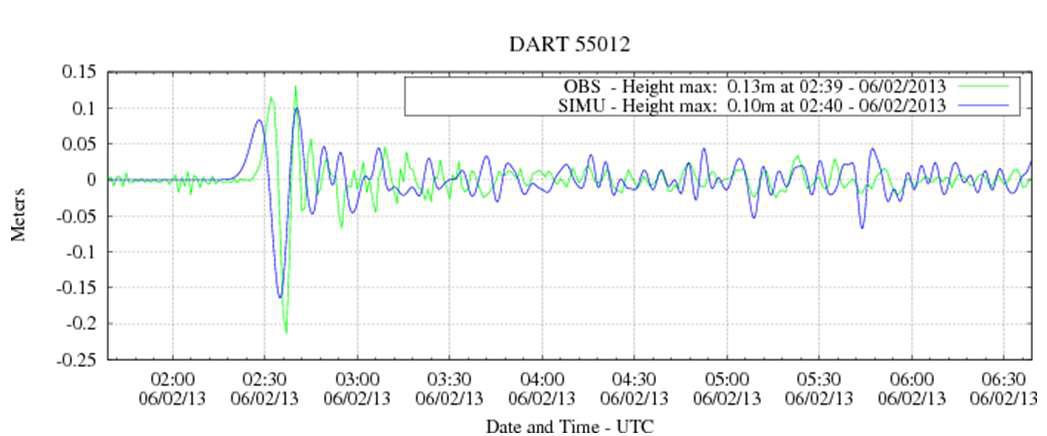
Figure 5: comparison between recording obtained from the DART 55012 buoy (see location on Figure 4) and a synthetic model of the tsunami.
Observations of the tsunami
The tsunami generated by the earthquake of 6 February 2013 was observed on tide gauges at various stations (see Table).
|
Measurement station |
Latitude
(° South) |
Longitude
(° East) |
Time of arrival (UTC) |
Amplitude
crest-to-trough (m) |
Amplitude
zero-trough (m) |
Period (minutes) |
|
Lata Wharf (Salomon) |
10.7208 |
165.8019 |
01:25 |
1.83 |
1.04 |
18 |
|
Luganville (Vanuatu) |
15.5156 |
167.1886 |
02:01 |
0.54 |
0.23 |
34 |
|
DART Honiara 52406 |
5.3320 |
165.0810 |
02:06 |
0.09 |
0.08 |
18 |
|
Vanuatu |
17.7553 |
168.3077 |
02:24 |
0.66 |
0.25 |
19 |
|
DART Coral Sea 55012 |
15.8000 |
158.5000 |
02:25 |
0.34 |
0.14 |
16 |
|
Hienghène, (New Caledonia) |
20.6929 |
164.9422 |
02:55 |
1.34 |
0.77 |
14 |
|
Lifou, (New Caledonia) |
20.9185 |
167.2787 |
02:55 |
0.96 |
0.33 |
7 |
|
DART Coral Sea 2 55023 |
14.8030 |
153.5850 |
03:05 |
0.10 |
0.05 |
12 |
|
Mare (New Caledonia) |
21.5478 |
167.8771 |
03:08 |
1.01 |
0.42 |
6 |
|
Ouinne (New Caledonia) |
21.9829 |
166.6833 |
03:25 |
1.14 |
0.49 |
10 |
|
Papeete (Polynesia) |
17.5331 |
149.5726 |
08:24 |
0.10 |
0.06 |
18 |
|
Hiva Oa (Polynesia) |
9.8049 |
139.0347 |
09:37 |
0.16 |
|
20 |
|
On New Caledonia, steps were taken to evacuate the nearshore populations concerned. An inhabitant of Poindimié reported that, owing to the lack of sirens, gendarmes and firemen went from door to door throughout the commune to alert the population using loud speakers. The tsunami caused no damage on the shores of New Caledonia. The tide gauge stations that were installed a few years ago now ensure a correct recording of the phenomena (Figures 6 and 7).
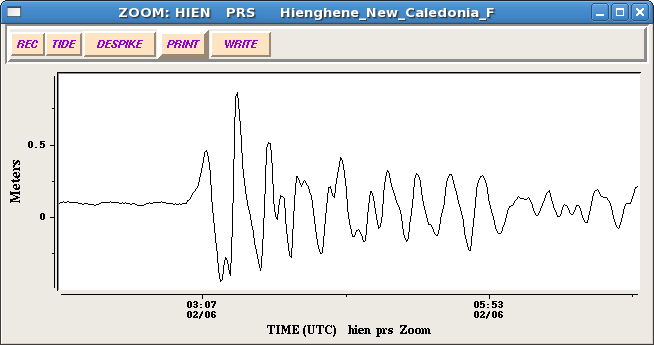
Figure 6: recording of the tsunami at Hienghène (New Caledonia).
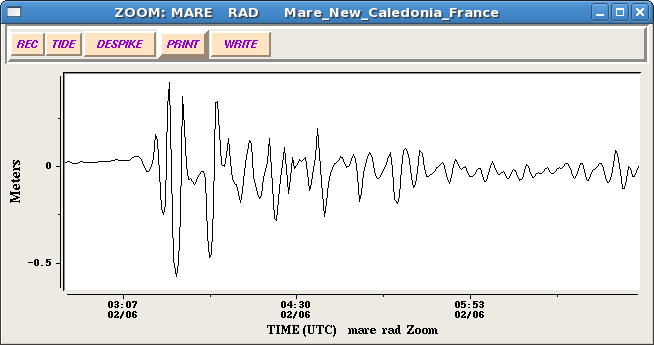
Figure 7: recording of the tsunami at Mare (New Caledonia).
In French Polynesia, the observations were very limited. The tide-gauge amplitudes do not exceed 10-15 cm, even in the Marquesas (Figure 8), in agreement with the estimates given by a tool for forecasting the effects of a tsunami used in the framework of the French Polynesia tsunami warning centre (Figure 9).
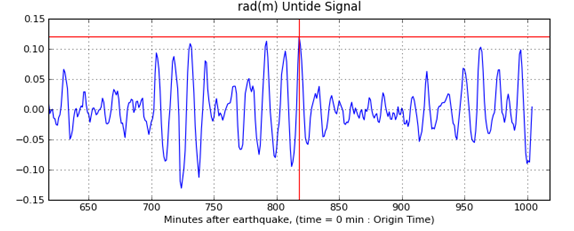
Figure 8: recording of the tsunami at Nuku Hiva (Marquesas).
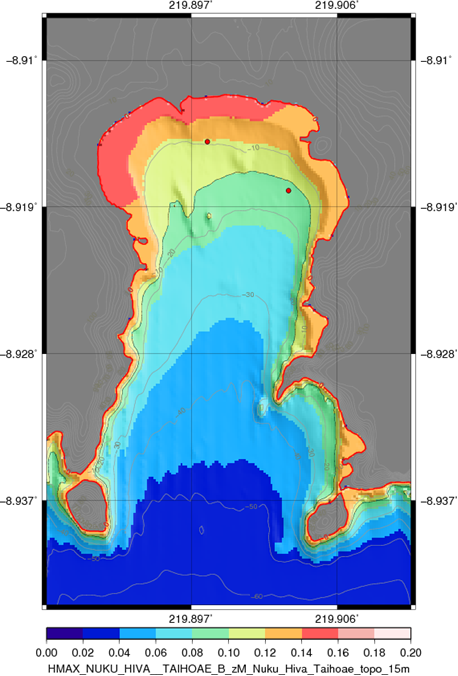
Figure 9: estimates of water height (scale in metres) at Nuku Hiva obtained by digital simulation tool for forecasting the effects of a tsunami.
|
|
|
)
)
)
)
)
)
)
)
)
)