| |


|
Eruption of the Chilean volcano Calbuco on 22/04/2015 monitored by infrasound stations |
On 22 April 2015, the Calbuco volcano in southern Chile, dormant since 1972, entered into eruption ejecting a thick plume of ash to an altitude of almost 20 km (Photo 1). After this violent and unexpected eruption, the Chilean government issued a red alert, ordering the evacuation of the population within a radius of 20 km of the volcano. The dispersion of the ash plume could be monitored by the Terra satellites of NASA. In the region of the volcano, a score of internal flights were cancelled. An alert was also given in the south of Argentina, which could be affected by the plume.
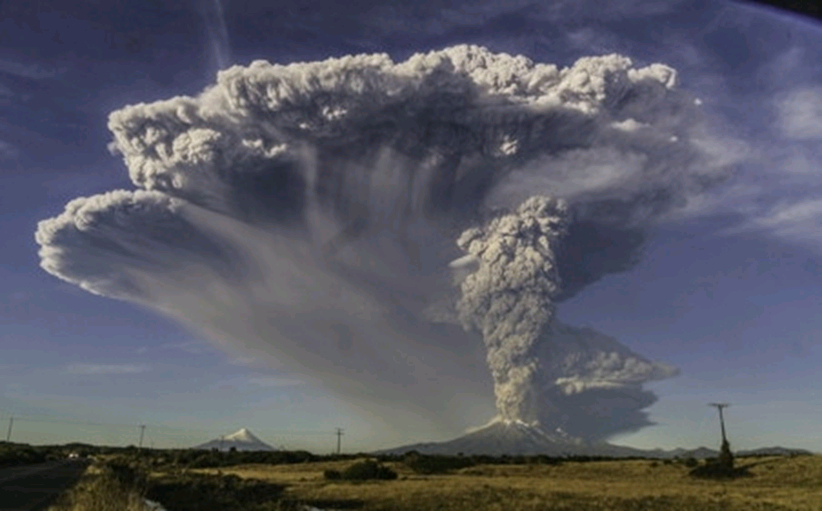
 Photograph 1: The plume of ash released by Calbuco volcano on 23 April 2015. Source: Marcelo Utreras © All rights reserved.
Chile has the second largest volcanic chain in the world after Indonesia, comprising approximately 90 active volcanoes, with Calbuco being regarded as one of the most dangerous. This volcano had not shown any signs of activity for more than 43 years. The current activity represents the second eruption in a few weeks recorded in Chile, following the eruption of Villarrica in March. This latter volcano is also located in the south of the country, and its eruption involved the evacuation of around 3,600 people.
CIMSS satellite images reveal gravity waves in the mesosphere (80-90 km altitude) generated by the shock wave of the main eruption (Photo 2). This intense eruptive activity was also detected by several infrasound stations belonging to the worldwide IMS network (International Monitoring System).
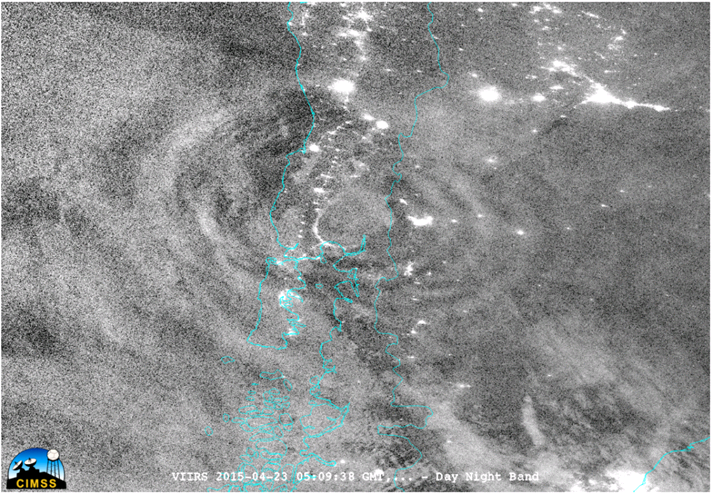
Photograph 2: Mesospheric gravity waves generated by the eruption of Calbuco volcano. Source: University of Wisconsin’s Cooperative Institute for Meteorological Satellite Studies (CIMSS, http://cimss.ssec.wisc.edu/).
 Processing infrasound data
Figure 1 shows an example of signals associated with the eruption of Calbuco on 22 April 2015, as detected by PMCC (Progressive Multi-Chanel Correlation algorithm, Cansi Y., 1995) and recorded at station IS08 in Bolivia, located at a distance of 2810 km.
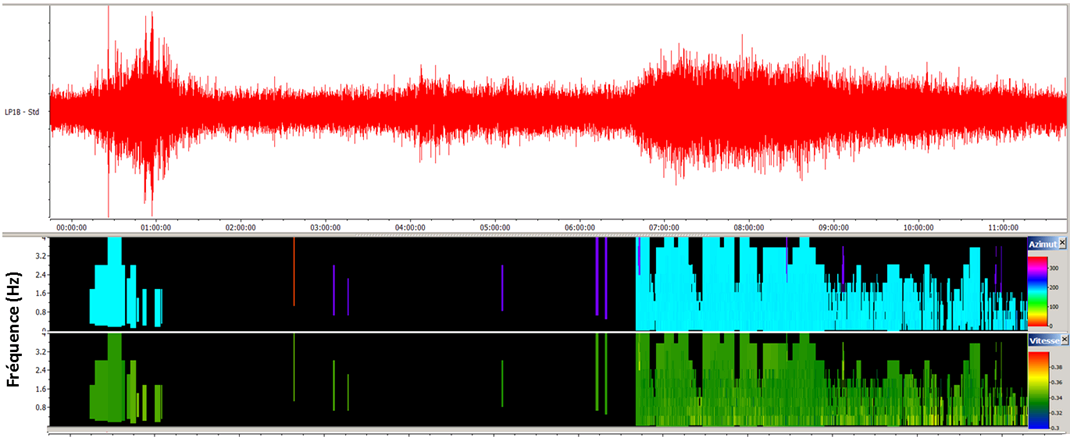
Figure 1: Representation of signals filtered between 0.5 and 4 Hz recorded at station IS08 in Bolivia. At bottom of figure, events detected by PMCC indicating speed and azimuth of waves between 0.1 and 4 Hz.
This analysis shows two main arrivals which could be associated with similar sequences at the other stations. The first eruption was recorded by 6 stations of the IMS, the most distant being located at more than 11,000 km (Table 1). The second eruption was recorded by 10 stations (Table 2). The most distant stations are located in the direction of the stratospheric winds, which reached speeds of 100 m/s at the time of the second eruption.
|
Stations |
Distance (km) |
Theoretical azimuth (°) |
Time of arrival(UT)
|
|
IS02 Argentina |
1525 |
343 |
22:50:59 |
|
IS08 Bolivia |
2810 |
187 |
00:09:19 |
|
IS09 Brasil |
3700 |
215 |
00:35:09 |
|
IS49 Tristan da Cunha United Kingdom |
5120 |
245 |
02:10:30 |
|
IS50 Ascension United Kingdom |
6795 |
230 |
04:18:00 |
|
IS32 Kenya |
11525 |
227 |
08:20:10 |
|
Table 1: Event associated with the first eruption at 21:50 UT on 22/04/2015.
|
Stations |
Distance (km) |
Theoretical azimuth (°) |
Time of arrival(UT) |
|
IS14 Robinson Crusoe Chile |
1010 |
149 |
05:39:14 |
|
IS02 Argentina |
1525 |
343 |
05:32:19 |
|
IS08 Bolivia |
2810 |
187 |
06:43:55 |
|
IS09 Brasil |
3700 |
215 |
07:23:05 |
|
IS27 Neumayer Antarctica |
4800 |
277 |
08:22:55 |
|
IS49 Tristan da Cunha United Kingdom |
5120 |
245 |
08:39:19 |
|
IS47 South Africa |
8570 |
230 |
11:52:04 |
|
IS35 Namibia |
8640 |
230 |
12:01:04 |
|
IS17 Ivory Coast |
8675 |
225 |
12:26:00 |
|
IS32 Kenya |
11525 |
227 |
14:58:20 |
|
Table 2: Event associated with the second eruption at 04:22 UT on 23/04/2015.
Using the set of infrasound signals recorded at the various stations and by ignoring the effect of winds on propagation, the two events were located by crossing of azimuths. For this purpose, we only consider the highest energy part of the signals of the two sequences recorded at all the stations and identified on Figure 1. For the two events, the calculated location is approximately 100 km away from of the true position. The simulation of wave propagation would make it possible to integrate the effects of upper-level winds and appreciably reduce this discrepancy. Figure 2 shows the localization of the second event.
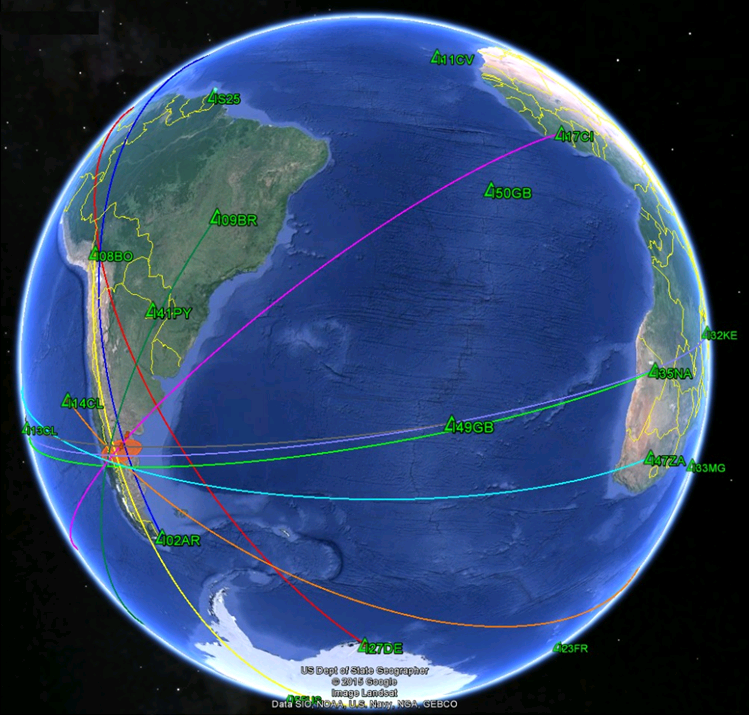
Figure 2: Localization of the second event obtained by crossing of azimuths of the stations (green triangles). The localization error is indicated by the orange ellipse.
Potential of infrasound for volcanic monitoring
The IMS network, supplemented by numerous experimental stations, so far ensures an effective global coverage for the detection and localization of active volcanoes at great distance (Assink et al., 2014). While the determination of the arrival times and azimuths of the waves leads to the localization of volcanoes, the measurement of certain signal parameters, such as amplitude or frequency content, can yield useful information about the intensity of the eruptions. More detailed studies would make it possible to quantify the effects of winds on wave propagation, and thus reduce the errors of localization as well as characterize the eruptive source. As a supplement to other observation systems (seismic, satellites, etc.), these studies contribute to the evaluation and optimization of an infrasound network for the remote monitoring of poorly instrumented dangerous volcanoes, in particular in the presence of cloud cover (Matoza et al., 2009).
In this context, in addition to existing arrangements for the monitoring of volcanoes (satellite, seismic, etc.), the European ARISE project proposes to use the IMS infrasound network to prevent risks related to the injection of ash clouds into the airspace. This work is undertaken in close connection with the Volcanic Ash Advisory Centers (VAAC) for the safety of civil aviation. The latest studies of the performances of the of the CTBT network depend on recent advances in simulation methods, which incorporate the effects of the source and atmosphere on propagation (Pichon et al., 2012). The developed methods allow a more precise assessment of the detection limits for a given network, thus offering a means of providing a confidence index on events of volcanic origin.
- Satellite views: https://earthdata.nasa.gov/labs/worldview
- Assink J. D., A. Le Pichon, E. Blanc, M. Kallel, and L. Khemiri (2014), Evaluation of wind and temperature profiles from ECMWF analysis on two hemispheres using volcanic infrasound, J. Geophys. Res. Atmos., 119, 8659-8683, doi:10.1002/2014JD021632.
- Cansi Y. (1995), An automatic seismic event processing for detection and location: The P.M.C.C. Method, Geophys. Res. Lett., 22, 1021-1024, doi:10.1029/95GL00468.
- Matoza R. et al. (2010), Surveillance à grande distance des éruptions volcaniques, Chocs Avancées 2010 (CEA), pp. 30-31, http://www-physique-chimie.cea.fr/science-en-ligne/docs/chocs-avancees/avancees2010.pdf.
- Le Pichon A., L. Ceranna, and J. Vergoz (2012), Incorporating numerical modelling into estimates of the detection capability of the IMS infrasound network, J. Geophys. Res., 117, D05121, doi:10.1029/2011JD016670.
- European project ARISE (Atmospheric dynamics Research InfraStructure in Europe, http://arise-project.eu).
|
)
)
)
)