 |
 |
 |
|
 |
|
 |
|
|
|
Infrasound in the atmosphere |
|
|
|
Infrasound has a variety of sources. These can be natural (meteorological disturbance, magnetic storms, wind, ocean swell, volcano eruptions, etc.) or artificial sources (explosions, supersonic aircraft, etc.). Infrasonic waves are elastic waves with frequencies below the audible range (<20 Hz), that are able to propagate over long range. Acoustic waves are propagated by multiple reflections on the various atmospheric layers and on the ground, with speeds at around 330m/s, helped or hindered (in varying degrees) by winds at high altitude. Propagations can take benefit from waveguides, especially in the stratosphere and thermosphere. Some infrasound sources are powerful enough (major volcanic or nuclear explosion) to shake the atmosphere, generating gravity waves with periods of a few minutes. These waves may propagate around the earth several times. |
|
|
|
 Tropospheric infrasound Tropospheric infrasound |
|
|
|
Ocean swell and mountain waves
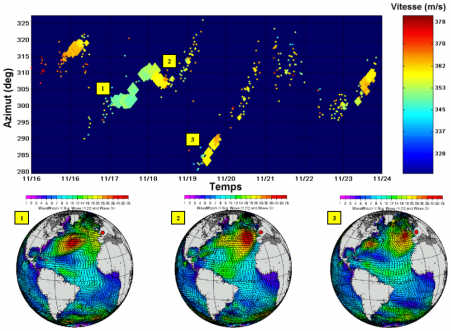
The most common infrasounds are caused by the effect of winds on mountains, and by ocean swell. They propagate at long distances and can be observed in almost all the infrasound stations around the world. North Atlantic ocean swell has been monitored from the Flers station in Normandy (Figure 1).
Moreover, in addition to ocean swell associated infrasound, waves with a period of 10 to 100 s are often observed. They arise from atmospheric turbulence over mountains exposed to strong winds. They can be observed continuously over several days. From observations in Mongolia, Guiana and Bolivia, the sources of these waves have been located in the Himalayas and the Andes cordillera.
 |
Figure 1: Measurement of the azimuth of the ocean swell recorded in Flers over several days. The color of the dots shows the computed horizontal speed values whose variations (between 0.34 and 0.39 km/s) indicate the reversal of winds at high altitudes. Cyclical azimuth variations are correlated with swell height maps for the Atlantic Ocean. |
Atmospheric storms
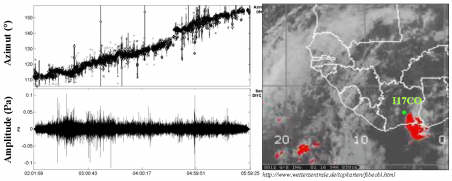
Atmospheric storms are another source of infrasound with more local effects (up to a few hundred kilometers from the storm front). The infrasound generated by thunder has a frequency of over 0.5 Hz. It can be identified through comparison with electromagnetic observations of lightning (Figure 2). Other types of infrasound are due to convective movements of air masses, in which case the period is about ten minutes.
|
Figure 2: Storm disturbance displacement detected by the IS17 station (Ivory Coast). |
Volcanoes
The infrasound produced by some volcanic eruptions can still be observed after traveling around the Earth. Eruptions like Mount St Helens (United States, 1980) or Mount Pinatubo (Philippines, 1991) released an energy comparable with megatonic atmospheric nuclear tests.
On a continental scale, infrasound from Mount Etna was detected in Flers and activity was monitored from May to July 2002. A correlation has been made with the same infrasounds detected by the IS26 station (Germany). On initial analysis, the location determined by azimuth crossing did not correlate with Etna's location precisely and fluctuated over time. The effects of high-altitude winds had to be corrected to produce an accurate location (Animation). Measurements of infrasound produced by volcanoes could be used in areas where volcano monitoring is scarce due to the risks of volcanic ash for air navigation.
Animation: Comparison of Etna locations (by azimuth crossing) with and without wind correction (black/red).
Click here to view the animation
Earthquakes
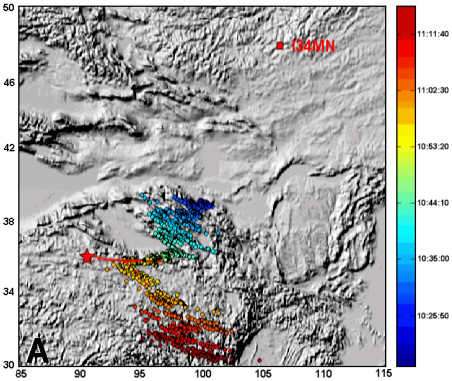
On September 14, 2001, an earthquake of magnitude 7.8 occurred in the north of China. For over an hour, the Mongolian IS24 station, located approximately 2000 km from the epicenter, recorded infrasonic signals with an azimuth variation of 20 to 30° (Figure 4.). A detailed analysis of the speed of the first coherent waves detected shows values that are characteristic of seismic waves. One of the mechanisms explaining these high values is the atmosphere-surface wave coupling during propagation. One hour after the first arrivals, waves propagating at acoustic speeds were detected. These measurements were used to retrieve the spatial distribution of the coupling areas between the vertical ground displacements and the atmosphere. These recordings confirmed that mountains can act as secondary acoustic sources when vibrating just after an earthquake.
|
Figure 4: Location of the secondary sources of infrasound generated by the earthquake in China. |
|
|
|
|
Infrasound from other sources |
|
|
|
The Earth is also subject to disturbances of external origin, such as meteors entering the atmosphere and solar flare, which cause magnetic storms and aurora borealis.
Aurora borealis
Aurora borealis produces infrasonic waves with periods between 0.1 and 100 s during the supersonic motion of auroral arcs at high latitude. In this case, the auroral oval, which is generally situated in high-latitude regions (~70°), expands to lower latitudes of the order of 45 to 50°. Even at middle latitude, the Flers (Normandy) infrasound station has already recorded signals that have been correlated with major magnetic storms.
Meteors
Meteors generate infrasound when entering the atmosphere and disintegrate at altitudes of about 50-100 km. When entering the atmosphere, a massive body, with a speed far greater than the speed of sound, instantly releases a large proportion of its kinetic energy, and a small shockwave is formed in the environment. It then undergoes significant deceleration before fragmenting and possibly reaching the ground. The formation of a shockwave associated with entry into the atmosphere generates infrasound whose characteristic frequency is used to determine meteor velocity and size.
|
 |
The disintegration of a meteor on December 29, 2000 above Tahiti (French Polynesia) gave rise to a rare seismo-acoustic recording by the permanent measurement network set up by the CEA in Polynesia. The event, whose source was located about 50 km from the infrasound station, was analyzed in order to determine some parameters of the meteor's trajectory. Calculations enabled the size of the fireball (a few meters) and the energy released during the explosion (about a hundred TNT equivalent tons) to be estimated. When the CTBT (Comprehensive Test-Ban Treaty) IMS (International Monitoring System) is fully operational, we estimate minimum meteor observation frequency at 1 or 2 meteors of this size per year and per station. |
|
|
On April 23, 2001, U.S. military satellites detected entry of a fireball into the atmosphere above the Pacific Ocean by infrared. Infrasonic waves were observed by several stations of the CTBT monitoring network and by the Flers station after propagation of over 10 000 km (Figure 5). The total energy of the explosion was estimated at 1 kiloton. Statistically, one or two meteors producing more than 1 kiloton of energy are detected each year worldwide. These measurements were added to the FIDAC (International Meteor Organization's Fireball Data Center) meteor database, until now maintained thanks to other observation systems. |
|
Figure 5: Determination of the meteor disintegration location on April 23 by azimuth crossing. |
|
|
|
|
Some examples of infrasound produced by human activity. |
|
|
|
CTBT infrasound stations must be permanently testable for performance monitoring purposes. Infrasound from known artificial sources (such as quarry blasts or supersonic aircraft) is used to optimize detection methods and to understand the effects of propagation on detected signals.
Supersonic aircraft
Supersonic aircraft-generated infrasound is similar to infrasound from nuclear explosions in terms of complexity, despite the fact that the latter are a powerful source that can excite low frequencies not excited by a passing supersonic aircraft. For example, the signals generated by Concorde approaching the European coastline were regularly recorded by several stations in Europe, and in particular the Flers station. The different detected phases corresponded to different paths in the atmosphere (Figure 6). Ray-trace modeling was used to identify these phases and to explain the measured parameters.
|
Figure 6: Processing by correlation of infrasonic waves generated by Concorde. The horizontal speed and azimuth values are coded by color scales in time-frequency diagrams. Several successive arrivals are observed with increasing horizontal speeds. The first phases [1-2-3] were reflected in the stratosphere (40-55 km). Because of the prevailing winds blowing in the propagation direction, these phases are only observed in winter. The last phase [5], of lower frequency, is reflected in the thermosphere (100-115 km). |
The analysis and interpretation of Concorde's signals over a continuous two-year period showed the effectiveness of modeling in explaining significant azimuth deviations. The variations in signal characteristics have been correlated with the diurnal and seasonal variations in the stratospheric winds. At certain times of the year and hours of the day, these deviations can reach 5° in relation to the initial propagation axis. They must be systematically corrected in order to reduce infrasonic source location errors. These measurements, when compared with modeling, are necessary for unambiguous phase identification, a necessary step in the source location process.
Quarry blasts
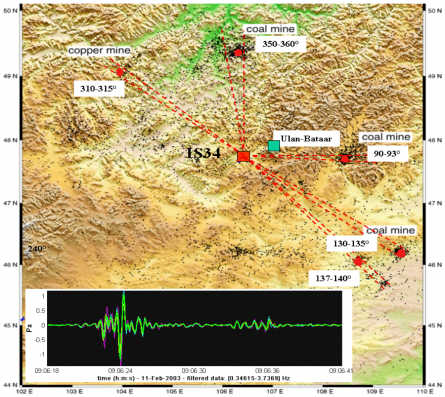
Surface explosions such as quarry or artillery blasts are also useful sources for checking detection and location efficiency, in particular when combined with seismic measurements. The arrival times of seismic and infrasonic waves, combined with appropriate speed modeling, can be used to locate sources. A map of the principal mining activities is then made covering distances of several hundreds of kilometers from the station (figure 8). This process is essential for discrimination purposes.
|
Figure 8: Seismicity map around the IS34 station (Mongolia). The main quarries located by seismic/infrasonic synergy are represented by red dots. Bottom: example of an infrasonic signal generated by a shot at a distance of 150 km from the station. |
The majority of this work is often conducted in partnership with other bodies. In particular, the simulation codes were developed in partnership with the Nice Sophia-Antipolis University Azur Geosciences Laboratory and the University of Hawaii (Institute of Geophysics and Planetology).The data recorded in the CTBT monitoring network stations are processed in partnership with the bodies responsible for these stations (Research Center of Astronomy and Geophysics for Mongolia, the San Calixto Observatory for Bolivia, the Institute and Observatory of Geophysics in Antananarivo for Madagascar, the Lamto Observatory for Ivory Coast and the (CEA) Pamatai laboratory for the Polynesian station).
|
| |
|
|
|