 |
 |
 |
|
 |
|
 |
|
|
|
Modeling and simulation of atmospheric transport |
|
|
|
Initiatives related to physical modeling and three-dimensional numerical simulation of atmospheric transport meet various requirements: |
|
|
|
|
 |
Prevention of malicious acts and response to the terrorist threat, |
|
|
Radio-ecological studies of sites and assessment of environmental and health effects, |
|
|
Rare gases and aerosol detection for monitoring compliance with international treaties (Comprehensive Nuclear Test-Ban Treaty - CTBT and Nuclear Non-Proliferation Treaty - NPT). |
Simulations concern the dispersion of radioactive or chemical materials in the form of gases or particles. Transport is determined:
|
|
on a local scale (from a few meters to 100 km), |
|
|
on a mesoscale (from a few tens to 1000 km), |
|
|
on a large scale (> 1000 km). |
|
|
|
|
 Local scale Local scale |
|
|
|
ESTET 3.4 code
3D simulations using grids provide accurate modeling of pollutant dispersion in a building, on an industrial site, or even in an urban neighborhood. In the following example, ESTET 3.4 fluid mechanics software was used and comparisons were made between experimental results and calculated results for test purposes.
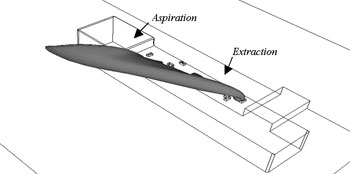
The industrial building, shown in Figure 1, features a ventilation system by which foul air is exhausted by extractors on the top of the building. This air can be recycled by an air vent, also located on the top of the building. The simulation, in very near-field conditions, of extracted foul air dispersion around the building shows that a very small quantity is likely to be taken in through the air vents, even in the worst situation when the wind is blowing along the extractor-air vent axis.
 |
Figure 1 |
|
|
|
|
ARIA Regional
ARIA Regional is a calculation code developed by EDF (French electricity board) and ARIA Technologies. It comprises several modules for the statistical processing of meteorological data and preparation of data for broadcast (Site Manager), calculation of runoff according to topography (MINERVE), and calculation of dispersion using the Gaussian gust model (TRAMES) or the Lagrangian particle model (SPRAY).
Calculated flows are representative of site climatology in terms of wind direction and modulus, and atmospheric stability. Calculation results for dispersion in the atmosphere and pollutant deposition have been successfully compared with experimental results, which substantiates both model and software capability. |
|
|
|
Mesoscale |
|
|
|
Mesoscale distances range from several tens to a few hundred km between sources and sensors for a travel time of 1 to 2 days. The codes used are MM5 and FLEXPART. MM5 is a code, widely used and approved by the scientific community, which solves atmospheric flow equations. As for FLEXPART, this is a "Lagrangian" dispersion code, which means that the source term is discretized by a large number of particles emitted in the atmosphere.
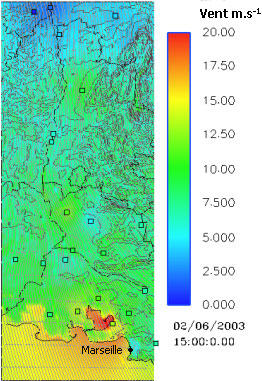
Within the framework of the CTBT, we are seeking to interpret the peaks of xenon detected by the Spalax network, an inline automatic sampling system with analysis of aerosols in the air and measurement of the radioactive isotopes of xenon. Flow and dispersion simulations greatly improve understanding of mesoscale phenomena. Thus, in the following example (Figure 2), calculations were made in the case of potential xenon detection in Marseille.
 |
|
Figure 2: Speed modulus and stream lines of the flow in the Rhône Valley at 3pm on February 6, 2003. Calculations obtained by MM5 on 3 nested domains in a two-way nesting approach. Final calculation with grid steps of 3 km, interpolated by MINERVE with 1 km accuracy. Domain size: 106 km x 262 km.
The squares show the positions of Météo-France stations. Their color depends on the locally measured speed modulus, using the same color scale as in the simulation. We observe that the MM5 results are close to the Météo-France measurements. |
|
|
|
|
Large scale |
|
|
|
For scales larger than 1000 km, the Military Applications Division (DAM) uses two complementary numerical atmospheric transport models. The HYSPLIT (Hybrid Single-Particle Lagrangian Integrated Trajectory Model) code is a Lagrangian particle code: one element of air volume is represented by one particle. The LMDZ code is a Eulerian general circulation model: the overall atmosphere is gridded, and the various physical quantities are computed within each grid.
The HYSPLIT model, the Algeciras example
In early June 1998, radioactive emissions were detected in the south of France, and subsequently in the whole of Europe. An enquiry ensued and it transpired that radiotherapy equipment containing a Cesium-137 (137Cs) source had been dumped and incinerated in the Algeciras area in the south of Spain. This incident was believed to have occurred on May 30, 1998.
The animation below shows the simulation, by the HYSPLIT code, of 137Cs dispersion between 0 and 500m altitude every 3 hours over a 3-day period. We presume that the source (red dot) emits 100 Bq between 00:00 and 03:00 on May 30, 1998. We can see that the south of France is hit by radioactivity, followed by the entire south-east of the country along with Switzerland and northern Italy, which is in keeping with the effective measurements. The yellow dots show the positions of the sensors that detected the Cesium during this event.
|
|
|
|
The LMDZ model, the radon 222 example
The 3D Eulerian model LMDZ is particularly suited to calculating radon-222 (222Rn) concentrations in the atmosphere. Radon is continuously emitted above continents. Its radioactive period is 3.8 days and its flux (1 atom/cm2/s) is known. Figure 3 shows the concentration in mBq/m3, calculated after a 10-day radon emission period, on January 10, 1998 above Western Europe.
|
Figure 3: Radon surface concentration (mBq/m3) on January 10, 1998. LMDZ simulations guided to ECMWF data (2.2°x2°: 160 x 98 cells with 19 levels) |
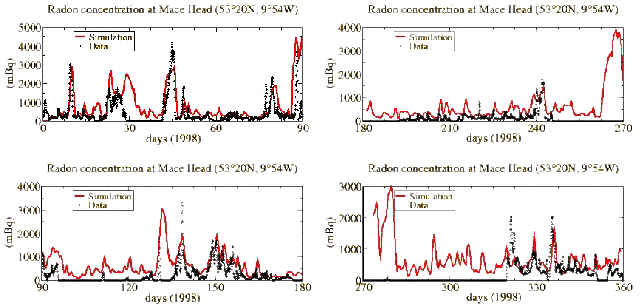
Meteorological field and concentration calculations can be tested by comparison with daily radon measurements (in some stations worldwide). The computed concentration (in red, Figure 4) is thus compared with the measurements (black dots) of the Irish station of Mace Head (1998). The chosen resolution for the LMDZ model is around 2°, and the initial radon concentration in the atmosphere is null. A period of roughly 10 days is required to reach equilibrium and to reproduce the observed radon peaks.
|
| |
|
Figure 4: Radon concentration on the ground in mBq/m3 in 1998 (day 1 to 360) for the coastal station of Mace Head, Ireland. The comparison of calculations (in red) and measurements (black dots) shows excellent correlation. |
|
|
|
)
)
)